Introduction
It has been widely recognized that an important component of process improvement is the ability to measure the quality of process. Even if the central role of software development plays in the delivery and application of the software, managers are increasingly focusing on process improvement in the software development area. This emphasis has had two effects. The first is that this demand has encouraged the provision of a number of new and /or improved approaches to software development. Second, the focus on process improvement has increased the demand for software measures, or metrics with which to manage the process. The need for such metrics arise when an organization is adopting a new technology for which “establish practices have yet to be developed.”
Given the importance of object-oriented development techniques, one specific area where this has occurred is coupling measurement in object-oriented systems. Object-oriented technologies are becoming inclusive in many software development organizations. The goal is to provide a scientific foundation for the engineering of object-oriented software.
Typically, object-oriented methodologies propose grouping classes into subsystems during the analysis phase in order to reduce the application complexity. A subsystem consists of a set of classes that are highly coupled. Other classes, with low coupling, are outside the subsystem. Coupling is a measure of the strength of association established by a connection from one entity to another. Classes (objects) are coupled three ways:
When a message is passed between objects, the objects are said to be coupled.
Classes are coupled when methods declared in one class use methods or attributes of the other classes.
Inheritance introduces significant tight coupling between super classes and their subclasses.
Stevens et al., who first introduced coupling in the context of structured development techniques, define coupling as “the measure of the strength of association established by a connection from one module to another”. Therefore the stronger the coupling between modules, i.e., the more inter-related they are, the more difficult these modules are to understand, change, and correct and thus the more complex the resulting software system. Coupling can be due to message-passing among class instances (dynamic coupling) or through static coupling. It has been noted that it is desirable that classes communicate with as few others as possible and even then, that they exchange as little information as possible. Coupling relations increase complexity, reduce encapsulation and effective reuse, and limit maintenance.
Coupling between objects (CBO) is a count of the number of other classes to which a class is coupled. It is measured by counting the number of distinct non-inheritance related class on which a class depends. Excessive coupling is unfavorable to modular design and prevents reuse. The more independent a class, the easier it is to reuse in another application. The larger the number of couples, the higher the sensitivity to changes in other parts of the design and thus maintenance is more difficult. Strong coupling complicates a system. Complexity can be reduced by designing systems with the weakest possible coupling between modules. This improves modularity and promotes encapsulation. CBO evaluates efficiency and reusability.
Previous Work Done
Henderson-Sellers5 describes various approaches into inheritance coupling and class coupling. Booch3 classifies these same two kinds of coupling as generalization/specialization and peer-to-peer coupling. Berard8 also presents an extensive discussion on the different possible ways of measuring class coupling. He classifies class coupling into interface coupling and internal coupling and outside internal coupling.
The concept of coupling has been extensively discussed in the literature. Originally it was used for accessing modules in structured design1,2. Coupling is the interconnection that occurs between modules.
Another approach is Object-Oriented Methodology. This proposes grouping of classes into subsystems during the analysis phase in order to reduce complexity4,6,7. A subsystem is a set of classes that are highly coupled. Coupling between two classes measures how much these classes depend on each other for accomplishing their responsibilities6. Responsibilities are the methods expressed by a class through its interface. Each sub-system can be designed independently and simultaneously to speed up the design process. But there is no precise way for identifying subsystems. This is a very subjective process in the sense that the resulting subsystem depend on who is analyzing the object interaction.
Our work focuses on pear-to-pear coupling at class level. None of the approaches we have just described have frequency associated with class interactions. That is, none of these metrics consider dynamic coupling.
Proposed Method
Dynamic Coupling Measurement
Typically, a development lifecycle consists of three main phases: analysis, design and implementation9. We apply DCM during the analysisphase of a use case driven, object-oriented methodology4, where class interactions are derived from use case description. For each use case a sequence diagram is constructed which describes the sequence of class collaboration that must occur so that the use case is executed.
Assumptions
As the DCM is applied during the analysis phase, no implementation details is required thus we are not concerned with the message content(parameters) and the amount of processing work that each class has to execute to fulfill its responsibilities. The DCM takes as input interactions between classes and not between objects. So we sum up the interactions for objects of class appearing in various sequence diagrams to get interaction between classes. DCM considers only concrete classes that interact and we also consider that this concrete class has already inherited the methods of its super class.
Assigning frequencies to Use Cases
We classify the refined use cases into two categories: Terminal use cases and internal use cases. A use case is considered terminal if it isneither extended nor used by any other use case, others are called internal use case.
We define the frequency of a terminal use case as the number of times that this use case occurs within a given interval. These frequencies are provided by the users. The interval is determined so that all terminal use cases occur at least once through all the use cases that it extends. If the terminal use case extends more than one use case, then the user must give the frequency with which this use case extends each of the other use cases.
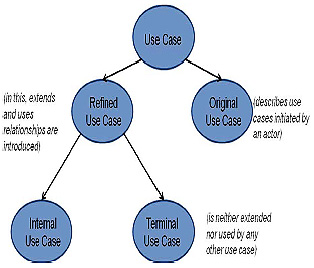
For determining the frequency of internal nodes we first consider the ‘extends’ relation and then the ‘uses’ relation. The frequency of internal node which is extended by one or more use cases is equal to the sum of the frequency of each use case that extends it. After this, we proceed by assigning the frequency to internal nodes that are used by other use cases. This is done by adding the frequencies of all use cases that use that internal node.
The frequency of the use case is propagated to the collaborations in its respective sequence diagram. As each of these collaborations may occur in more than one use case, the frequency of the collaborations in the collaboration graph (CG) is given by sum of all the frequencies from the sequence diagrams in which this collaboration occurs.
The Input
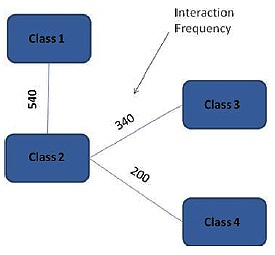
The Interaction Graph (IG) is derived from CG which is given as an input to DCM. In the IG, vertices represent classes and edge represents the interaction between the classes. The weight of an edge is the frequency with which the two connected classes interact. Interaction frequency between the classes is calculated by summing up the interaction frequency of the collaboration between those classes.
The Process
The DCM takes IG as input and starts by creating one cluster for each class, called as singleton cluster. The DCM also takes Cluster Threshold (CT) as an input. If two classes interactingwith each other with a frequency greater than CT, and the belong to different clusters, then we must be combine the two clusters. CT is the minimum interaction frequency between two classes that will promote combining their respective clusters.
The Algorithm for DCM:
1. For each class we will make a Singleton Cluster (i.e. cluster with only one class).
2. Now for each interaction between these classes, if:
a. Class A and B belong to different cluster.
AND
b. Interaction frequency between Class A and Class B is greater than Threshold Frequency, THEN
c. Merge the two classes into one cluster.
3. Repeat step 2 till all the interaction between different classes is assessed.
Merging two clusters replaces those with a single cluster, which is the union of the two original clusters.
The Algorithm Definition and Properties
Definition 1: Two classes A and B directly interact, if either A invokes a method form B or B invokes a method from A, or both.
Definition 2: A path between two distinct classes A and An is sequence <A1, .. , An> of classes where classes Aj and Aj+1 directly interact with a frequency Fj > CT, for j = 1, …., n-1.
Assessing Hot Spots
When we run the above algorithm with respect to a given threshold we won’t be able to capture all the different hot spots of the application. That is because, for a given threshold, all the classes that have their maximum interaction frequency below the current threshold will not be clustered. Thus we will be running our algorithm at different frequencies. For different values of threshold frequency, we will get different hot spots.
Now to assess the importance of the hot spots with respect to class development at designand implementation phase, we have a metric system
We add up the frequencies of the classes inside the cluster (IN) and also add up the frequencies of the interactions crossing the cluster boundary (OUT).
If IN > OUT: The activities inside this cluster are highly used by the application, and therefore should be carefully designed.
If IN<= OUT: The activities are not so frequent when compared with the frequency that classes inside the cluster interact with classes outside the cluster.
Experimental Results
We have tested the DCM along with the metric with the Grader system[10]. We constructed the use case models and respective sequence diagrams, collaboration graph and interaction graph for the application. We also represent the interaction graph as a matrix in a similar way with the difference that each cell has the frequency with which the row and column classes interact.
For the application we use the following scenario:
Assign frequency to the refined use cases using the assignment procedure.
Run the DCM with threshold equal to each of the possible frequency values assigned to the use cases.
For each run, apply the metric proposed in the previous case.
We repeated this scenario many times for each of the applications, each time assigning different frequencies to the use cases. We decided to vary the threshold according to the possible frequency values assigned to the use cases so that we could analyze how classes were dynamically coupled with respect to the use cases (which represent application processing).
Grader System
The Grader System has 42 use cases in the refined use case model and 69 classes10. In this section, we discuss the results after running the DCM with the Grader System where the terminal use case frequencies were provided by the application users. The frequencies for internal use cases were derived using the assignment process and the interval considered for the use case frequencies was equal to one school term.
We also tested the DCM with the Grader System on many other scenarios with different frequencies for the terminal use cases, but in general the results were similar to those that we present next.
Tables A and B present the results for this scenario. Table A shows the number of singletons and non-singleton clusters identified at a given threshold, the number of classes inside the cluster and the values for the metrics variables (IN and OUT) along with the ratio of these values.
As presented in Table A, we vary the threshold from the lowest use case frequency, which is 2 per term, to the highest use case frequency, which is 2601 per term. Having the information about the number of use cases with respect to the current threshold, we can analyze how the classes are dynamically coupled with respect to the application processing. for the Grader System in this scenario, we observe that the number of singleton clusters does not increase significantly as the number of use cases that have frequency less than or equal to the threshold increases. That means the classes that are used by these use cases are not so tightly dynamically coupled. That behavior is also due to the fact that for each use case, the analyst assigned one control class to coordinate the activities described by use case. And these classes are not used by any other use cases, but only in the use case that they were assigned to coordinate. Therefore, when the threshold is equal to the frequency with which the use case of a control class occurs, that control class becomes a singleton cluster.
In terms of non-singleton clusters, for lower thresholds, most of the time we have only one big cluster with almost all the classes. However, applying the metric for this big cluster is not so effective. This cluster has almost all the classes and the metric does not provide any relevant information for the designers to decide for which classes they should focus their development effort. For threshold equal to 10 we have two clusters. But as depicted in Table B, one of these clusters is still the big cluster, and the other is just one small cluster with two classes. The metric for this small cluster is more effective than with the big cluster. It shows that the classes in these clusters are not so dynamically coupled. The value in the IN column is less than the value in the OUT column, which means that the activity performed by these classes are not so frequent when compared with the frequency that they interact with classes outside the cluster.
The metric is more effective for higher threshold values when the DCM identifies hot spots with classes that are more highly dynamically coupled. For the Grader System in this scenario, more significant non-singleton clusters with respect to the metric start to appear with threshold values above 600. The two non-singleton clusters that appear at this time do not have so many classes in them as opposed to the initial big cluster from lower threshold values.
They provide good hot spots for the designers. The values in the IN column for these clusters are greater than the values in the OUT column, meaning that the activities performed by the classes in these clusters are highly needed by these application. Designers should carefully design these classes so that the application performance can be improved.
Implementation
Dynamic coupling measures are integrated into existing iterative process. The first few steps are identical to the original process. The improvement is visible in the Reengineer Procedures cycle. Then comparing with the original process, Dynamic Coupling Evaluation, another step is added and Equivalence Test is enhanced.
Once a given component has been reengineered, the process is repeated and next component is reengineered, until the whole legacy system has been reengineered. The iterative model allows the coexistence of the old and new system and it can ensure the system keep working during the reengineering process. Improved process takes full advantage of the runtime information in Equivalence Test and generates dynamic coupling measures in Dynamic Coupling Evaluation phase.
1) Analyze Legacy System
During reengineering process, many maintenance requirements are involved which affect on different sets of components. Requirements should be managed carefully. A requirement should be hold until all relative components are replaced. The first step in the iterative process is identifying and mapping all legacy components to every maintenance requirement.
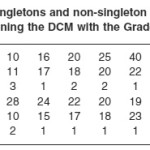 |
Table 1: Number of use cases, singletons and non-singleton clusters with respect to different thresholds. Results after running the DCM with the Grader System for scenario ONE.
Click here to View table
|
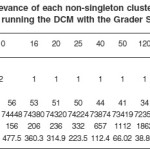 |
Table 2: Results on the relevance of each non-singleton cluster with respect to different thresholds. Results after running the DCM with the Grader System for scenario ONE
Click here to View table
|
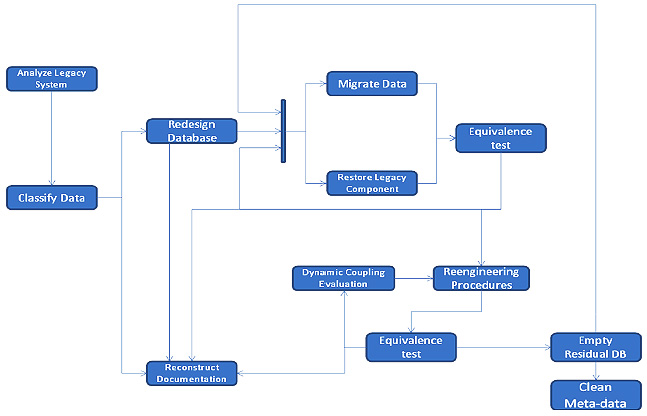
2) Classify Data
Legacy data records are other critical factor in reengineering process. They are identified and interpreted according to the background. The results include data name, data type and brief description. User can define the data type based on the different business scopes. The purpose of this step is helping software engineers understand the system data.
3) Redesign Database
In previous phase, software engineers have classified and understood the data records in legacy system very well. In this phase, software engineer can redesign the database. The guidelines are keeping primary business data which is necessary for executing business functionality, removing residual control data which are only related to legacy system implementation and enhancing or restructuring data records which are essential for implementing new system design.
4) Restore legacy components and Migrate Data
Different from previous steps, these two steps are normally executed concurrently in every iterative cycle. Before every iterative cycle, the access of all data records should be redirected in every related legacy components. These activities are named as Restore legacy components. The purpose is only making the new system compatible with the original one when the data are migrated. Meanwhile, the legacy data records are migrated from old format to redesigned database.
5) Equivalence Test
In original iterative process, engineers ensure that the functionalities and operation of the reengineered system is the same as the one before by executing all test cases to. In additional, collecting dynamic coupling data which are used to perform following Dynamic Coupling Evaluations is enhanced.
6) Reengineer Procedure
In this phase, software engineers analyze the degraded procedure and introduce suitable remedies to improve the functionality and quality requirements.
Normally, they perform three activities:
managing the data access and their relations to present domain knowledge clearly;
updating user interface and making it friendlier to enhance users’ experiences;
executing maintenance requirements to fulfill the functionality requirements. , an additional task, collecting dynamic executing information, is added to enhance the original iterative process.
At the end of this phase, the preconditions for dynamic coupling are ready.
7) Dynamic Coupling Evaluations
This is the emphases of this paper. In reengineering projects, external quality is one of the significant standards. Software coupling measures are involved in our process to make the reengineered system reach high external quality. Evaluations on system or component level are performed by aggregating class level coupling to help software engineers improve external quality reengineer procedure phase.
8) Empty Residual DB
Our iterative process allows residual DB work with redesigned DB together. The residual DB will be removed until they are not access by reengineered system.
9) Reconstruct Documents
This phase should be executed for every phase in the process, because it is necessary to keep the documents up to data and can describe the system’s implementation.
Conclusion
We have proposed a Dynamic Clustering Mechanism that identifies the hot spots during the analysis phase of a use case driven, object oriented methodology by assessing class dynamic coupling. Dynamic coupling is based on the frequency with which classes interact at runtime. Class interaction frequencies are derived by propagating use case frequencies to sequence diagram. Users have to only provide frequency for the terminal use case, for the other use cases frequencies are automatically derived from these initial frequencies.
We have implemented the DCM using a simple linear algorithm. We use different threshold frequencies to create clusters. These clusters consists of highly interacting classes and dividing and allocating them to distinct network nodes would imply having communication over the network channel.
References
- Myers, G.J Composite/Structured Design. Van Nostrand Reignhold Company, (1978).
- Yourdon, E. and L. Constantine. Structured Design : Fundamentals of a Discipline of Computer Program and System Design. Prentice Hall, (1979).
- Booch, G. Object-Oriented Analysis and Design with Application. Addison-Wesley, (1944).
- Jacobson, I., et al. Object-Oriented Software Engineering: A use case driven approach. Addison-Wesley (ACM Press), (1992).
- Henderson-Sellers, B. Object-Oriented Metrics. Measure of Complexity. Prentice Hall, (1996).
- Wirfs-Brock,R., B. Wilkerson, and L. Wierner. Designing Object-Oriented Software. Prentice Hall, (1990).
- Henderson-Sellers, B. and J. Edward. Book Two of Object-Oriented Knowledge: The Working Object. Prentice Hall, (1994).
- Berard, E. V. Essays on Object-Oriented Software Engineering. Prentice Hall, (1993).
- Pressman, R. S. Software Engineering: A Practitioner’s Approach. McGraw Hill, (1997).
- Delcambre, L., and Ecklund, E. Analysis of the Grader System.
- H. Zeus, “Properties of Software measure”, vol 1, (1992).
- J. Banerjee, H. Chou, J. Garza, W. Kim, D. Woelk, and N. Ballou, “Data model issues for object oriented applications,” ACM Trans. Oflce Inform. Syst., 5:(1987).
- D. P. Tegarden, S. D. Sheetz, and D. E. Monarchi, “Effectiveness of traditional software metrics for object oriented systems,” presented at the 25th Annu. Conf. Syst. Sci., Maui, HI, (1992).
- E. Weyuker, “Evaluating software complexity measures,”IEEE Trans.Software Eng., 14: (1988).
- V. Basili and R. Reiter, “Evaluating automatable measures of software models,” in IEEE Workshop Quantitative Sofware Models, Kiamesha, NY, (1979).

This work is licensed under a Creative Commons Attribution 4.0 International License.