Introduction
The rationale behind Data Mining (DM) is that it provides methods and systems that can automatically find general meanings based on vast and complex, data. The DM Systems (DMSs) usually ignore the number of parameters and it is not always possible to come up with generalizations even when data are available.
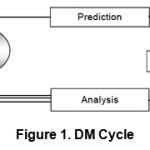
DM applications follow the empirical cycle of theory formation, shown in Figure 1. By collecting observations from our universe and analyzing them by means of established mathematical methods, one can come up with a theory that allows us to predict new events about the universe. By discovering hidden information patterns and relationships in the records, users extract greater value from their data than simple query and analysis approaches. This requires a model consisting of independent variables that can be used to determine a dependent variable. Next, the relevant independent variables are identified and while trying to minimize the predictive error. To identify the model that has the least error and is the best predictor may require building numerous models to select the best one. Fortunately, today’s technology has reached a point regarding computational power, storage capacity and cost that makes feasible to gather, analyze and mine huge amounts of data [1,2].
In general, DMSs must be scalable due to data size and complexity. Scalability means that as a system grows, its performance increases accordingly [12]. DM scalability takes advantage of parallel database management systems and additional CPUs and implies that the DMS can solve a broad range of problems. More data can be added, more models built, and accuracy can be improved by simply adding additional CPUs. Ideally, scalability should be linear or better.
Data Analysis (DA) and DM are not the same thing. In the traditional query-driven approach, one generates questions based on personal domain knowledge and perhaps guided by a hypothesis to be tested. Hence, the answers to these issues help to deduce a pattern or verify the hypothesis about the data. Activities based on queries, reports and Online Analytical Process (OLAP) systems often consider these actions DM; but, they run into trouble when try to generalize from the uncovered information and use it as a guide to future actions. A description is not the same as a prediction. DM uses a variety of DA tools to discover patterns and relationships in data that can be used to make reasonably accurate predictions. The DM goal is a prediction while generalizing patterns to other data, exploring and describing the database. Traditional approaches may result in inadequate predictions that fail to select the most appropriate attributes for the database. As database structure gets complex, it becomes virtually impossible for any individual to know the data well enough to say with certainty which variables affect its behavior. Since the best predictors may not be individual attributes, but rather a combination of attributes exacerbates difficulties.
As DM is essentially an iterative process, quantitative results are checked and revised as needed until a meaningful predictive model evolves. The knowledge of an expert may guide the analysis of the data and the manipulation of variables. DM also addresses another descriptive approach fault: even after a pattern is unearthed through a series of queries, the analyst cannot be sure if that pattern is true for anything other than the collection of data used to find it.
DM verifies if the discovered patterns can be used for prediction (i.e., that they are applicable beyond the original database) via techniques, such as dividing the database into two sets: one for training and developing a predictive model and other for testing purposes. DM can assess both the mathematical accuracy and the potential costs and revenues of a particular predictive pattern. Evaluation of new predictive models ensures their meaningfulness and improve results considerably.
This paper explores important and interesting DM issues related to healthcare. Section 2, overviews DM techniques. Section 3 comments on data types. Case studies are presented in Section 4. Challenges are addressed in Section 5. Finally, conclusions can be found in Section 6.
Dm Methods – An Overview
Pre-processing
Before using DM techniques, it is essential to pre-process records to analyze the multivariate data sets. The target set is then cleaned to remove the observations containing noise and those with missing data. This treated data set must be large enough to contain true data patterns while remaining concise enough to be mined within a tolerable time limit. A common source for data is a data mart or data warehouse.
Prediction
Classification
Classification is the task of devising how data are structured. For example, a blob may be classified as “malign” or as “benign”. Assume there is a set of observations from a particular domain. Among this set of data, there is a subset of data labeled as class 1 and another subset of data labeled as class 2. The goal is to find a mapping function that separates samples from class 1 from those belonging to class 2 while allowing prediction of the class membership of new formerly unseen samples. The two-class problem was considered for the sake of simplicity but there can be more classes. The mapping function can be learned by decision tree or rule induction, neural networks, statistical classification methods or case-based reasoning [1, 3].
Regression
Regression attempts to find a function modeling the data with the least error. Whereas classification determines the set membership of the samples, the answer of regression is numerical [9].
Knowledge Discovery
Deviation Detection
Real-world observations are random events. The determination of characteristic values, such as the quality of an implant, the influence of medical treatment to a patient group or the detection of salient regions in images can be done based on statistical parameter tests. Methods for the estimation of unknown parameters, hypotheses test and the estimation of confidence intervals in linear models [8] help uncover knowledge.
Cluster Analysis
Clustering finds groups and structures in the data that are in some way or another similar without using known structures in the data. Many objects that are represented by an n-dimensional attribute vector should be grouped into meaningful groups. The concept of similarity allows measuring the closeness of two data, to evaluate their closeness and assign class labels to datum according to its group membership. The database can serve as the basis for classification.
Visualization
Summarization offers a more compact representation of the data set, including visualization and report generation. Humans do not examine numbers with ease, thus summarizing data into a proper graphical representation may give a better data insight [1, 3]. E.g., a dendrogram can help illustrate groupings, and understand the relations among the various groups and subgroups. An extensive set of rules is easier to understand when structured hierarchically and graphically in the form of a decision tree.
Association Rule Learning (ARL)
ARL aka dependency modeling searches for relationships between variables. For example, a gym might gather data on customer eating habits. Using ARL, the gym can determine which products are frequently bought together and use this information for advertising purposes. The existence of brain lesions in MR images may suggest other types of lesions having a clear spatial relation to other structures. To count the occurrences of such a pattern hints at the diagnosis. Methods on ARL appear in [6, 11].
Segmentation
Suppose a medical database has been mined for patient profiles and health specialists want to call in patients for a specific medical test with a given profile. The process of separating only those data that meet a given profile is called segmentation.
Dm From The Data-Type Perspective
DM can also be addressed from the data-type perspective because this may affect the preparation of the records for the mining process and the data representation [1, 2, 4, 7].
Though pixels and voxels of an image are of numerical data type, it is wise to use the whole image for mining purposes. Usually, the original image is distorted or corrupted by noise. Pre-processing, high-level information extraction and a small number of records lessen the influence of noise and distortions. The extraction of high-level information allows image content understanding.
Text categorization or classification requires an understanding of the content of the documents. Therefore, the document has to go through different processing steps depending on the form of the available text. A digital document version must be described in words and unnecessary formatting instructions must be removed, and the problem of the contextual word sense or the semantic similarity between different words must be solved [1, 2]. Time-series analysis recognizes events (changes from normal status) in the mining process [10]. Web mining extracts necessary information about data types by document parsing, but the final representation can be either numerical or symbolical. More complex representations like strings, graphs, and relational structures are also possible.
Attributes can be numerical or categorical. A measurement scale characterizes numerical variables such as temperature and pixel intensity. Categorical data have a set of types as the size of an object described by the labels small, medium, and big. Nominal categorical variables do not have a natural ordering but ordinal variables have ordered levels. A pixel may be black, gray, or white where a gray level lies between black and white.
An interval variable belongs to a numerical range or interval. In the measurement hierarchy, interval variables are highest, ordinal variables are next, and nominal variables are lowest.
Only an attribute-based description might not be appropriate for multimedia applications. The global structure of a given object or scene, the associated semantic information, and their relation might require an attributed graph representation.
Case Studies
In-Vitro Fertilization (IVF)
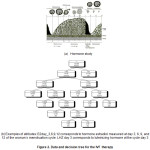
Although IVF has been in use for several years, physicians had not been able to develop a clear model of its function and its effect due to the complex interlocking of biological, clinical, and medical facts. The over-stimulation syndrome is an IVF problem with an associated set of rules describing the diagnosis knowledge for mining a database. Therefore, doctors built up a database where characteristic parameters and clinical information of a patient were recorded. This database contained parameters from ultrasonic images such as the number and the size of follicles recorded on certain days of the women menstruation’s cycle, clinical data, and hormone data. This database was used and analyzed with decision tree induction. Figure 2 shows a possible learned decision tree for the IVF-therapy containing decision rules. It described the diagnosis model in such a way that medical doctors can use and follow it [1, 2]. The framework can be split into two stages:
Exploratory Phase
The learned rules help experts understand the therapy effects once knowledge is conveniently represented by, for example, a decision tree. The trust in this data gets higher when s(he) found among the whole set of rules a few rules that s(he) had already built up in past. This knowledge gives new impulses to think about the effects of the hormone E2 therapy as well as to acquire new necessary information about the patient to improve the success rate of the therapy as follows:
IF (E2 at the 3rd cycle day) ≤67 AND (number of follicles ≤16.5) AND (E2 at the 12th cycle day ≤ 2620) THEN Diagnosis=FALSE.
Prediction Phase
A good model called diagnosis of over stimulation syndrome for a sub-diagnosis task of IVF-therapy resulted from some experiments to predict the development of an over stimulation syndrome for new incoming patients. Experiments at that time showed that the recent diagnostic measurements are not enough to characterize the whole IVF process but enough to stimulate new discussions and to give new directions for the therapy [1, 2]. Knowledge about diagnosis came from a data set recorded from all patients based on DM. By summarizing these data into a set of rules, the method helps humans understand the pathology. Usually, humans built up such knowledge by experience over the years.
Content-Based Image Retrieval (CBIR)
Radiology involves a typical application of CBIR in the healthcare domain. Some of the main issues involved in the design of a CBIR System (CBIRS) are:
- Identification of potential users of the application.
- Study of the existing techniques for CBIR.
- Maintenance of a database of actual medical cases and images.
- Deciding upon which image features to be extracted and similarity metrics to be used.
- Make the system web deployable.
- Organize authorized access to the CBIRS.
- Web-Based efficient Graphical User Interface (GUI)
Feature extraction can involve text-based features or visual features. In the first case, keywords and annotations are used to build to portray and to index images. The second one relies on general attributes such as color, texture, shape and other domain-specific features that can be extracted. Wide-ranging features from the query and other images stored in the database are extracted, based on their pixel characteristics, so that the system compacts image information (feature database), which is also called image signature [3, 14, 15].
Descriptors are the first step to finding out the connection between the pixels contained in an image and what humans call to mind after having observed an image or a group of images after some minutes. Visual descriptors can be (a) general, which contain low-level data that represent color, shape, regions, textures, motion, etc.; and (b) specific domain, which provide information about objects and events in the scene. Descriptors can be global or local and combined to form a Feature Vector (FV) whose entries are image features. E.g., if an image is described by contrast c, dissimilarity d, homogeneity h, angular second moment a, and entropy e, then an FV f= [c, d, h, a, e] represents this image.
Although humans can easily recognize related images, similarity metrics are needed to test the effectiveness of a CBIRS [3, 14, 15, 16]. Two evaluation measures, namely Precision (P) and Recall (R) are commonly used. P is the ratio involving the Number of Relevant Images Retrieved (NIR), that is documents recovered by the system that are in fact relevant to the query, and the number of Total Retrieved Images (TID). R is the relative amount between the NIR and the total Number of Pertinent Images Existing in the Database (NID). They can be expressed by
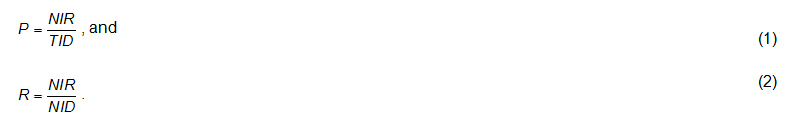
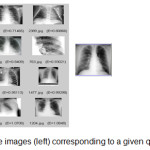
High accuracy means that less pertinent images come from a query or that a more relevant range of images is recovered. A high recall means few relevant images are neglected. The matching procedure compares the image signature of the query image to the other database image signatures via the calculation of some distance measure. Subsequently, images are ranked according to distance thresholds like the popular Euclidean distance. Next, the system returns the outcomes with high visual similarity. Feature matching can be performed in two ways: (i) by region comparison, in which segmentation can obtain regions and, then, the distance between two regions is measured based on their low-level features; and (ii) by image comparison, which consists of a number of regions. In recent years, several other distance measures have been developed for histograms such as city-block-distance and the Minkowsky distance [3, 15]. Figure 3 shows the Cumulative Distribution Function (CDF) plot for radiological image characterization. Figure 4 presents a set of images resulting from the query image on the right side.
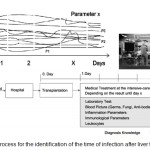
Identification of the Time of Infection after Liver Transplantation
Suppose there is a database for a certain disease with patients’ data, clinical and laboratory values as well as disease details. DM techniques can improve the disease knowledge to make prognoses for new patients and to forecast likely complications. Figure 5 illustrates this process for the prediction of the day of the infection after liver transplantation.
Challenges And Future Work
Anomaly detection (also known as outlier or change or deviation detection) comprises unusual data records that might be interesting or data errors that need further investigation.
The final step of knowledge discovery is to verify if the patterns produced by the DM algorithm occurs in the wider data set (result validation). Not all identified patterns are necessarily valid because some patterns in the training set do not appear in the global dataset (overfitting). To overcome this, the evaluation may use a test and training sets. The learned patterns are applied to the test set, and the output is compared to the desired output. For example, a DM algorithm trying to distinguish false from legitimate tumors would process a training set of sample tumor images. Once trained, the learned patterns would work on the test set of tumors, which is different from the training set. The patterns accuracy can then be measured from how many tumors they correctly classify. Several statistical methods such as ROC curves may be used to evaluate an algorithm. If the learned patterns fail to meet the desired standards, it is necessary to re-evaluate and change the pre-processing and DM steps. Otherwise, the final step is to interpret the learned patterns and turn them into knowledge.
DM calls for data dimensionality reduction procedures, because large amounts of data may sometimes yield worse performances in DA applications [13].
Image fusion combines images from a single target taken by different sensors under different conditions to form a single image better than any of the individual ones. Since both DM and data fusion are computationally expensive more research is needed to improve health care KDD systems [17].
Semantic gap refers to the difference between two object descriptions using different representations like languages or symbols. Great challenges come from the semantic gap such as to describe semantic features well and to devise efficient semantic association models between various heterogeneous data sources [3, 14].
Conclusion
This paper explains DM and overviews its basic methods. Health care applications were described to give an idea about DM uses with the data side in mind. Data such as images, video or audio involve more complex data structures.
Misused DM can produce results which appear to be significant; but which do not predict future behavior and cannot be replicated on a new sample of data and bear little use. Frequently this happens when investigating too many hypotheses and not doing appropriate statistical hypothesis testing. In machine learning, this is known as overfitting. The same problem can happen at different process phases and thus a train/test split (when applicable) may not be sufficient to prevent this from occurring.
References
- Perner, P. and Fiss, G. 2002. Intelligent E-marketing with web mining, personalization and user-adapted interfaces, Advances in Data Mining, Applications in E-Commerce, Medicine, and Knowledge Management, Springer Verlag, 37-52.
- Perner, P. 2002. Data Mining on Multimedia Data, Springer-Verlag, 1-11.
- Herrmann, A.E. and Estrela, V.V. 2016. Content-Based Image Retrieval (CBIR) in Remote Clinical Diagnosis and Healthcare, Encyclopedia of E-Health and Telemedicine. Doi: 10.4018/978-1-4666-9978-6.Ch039
CrossRef
- Blanc E. and Giudici P. 2002. Sequence Rules For Web Clickstream Analysis, Advances In Data Mining, Applications In E-Commerce, Medicine, And Knowledge Management, Springer Verlag, 1-14.
- Caelli, T., Amin, A., Duin, R.P.W., Kamel, M. and Ridder, D. 2002. Structural, Syntactic, and Statistical Pattern Recognition, Springer Verlag.
- Hipp, J., Güntzer, U. and Nakhaeizadeh, G. 2002. Data mining of association rules and the process of knowledge discovery in databases, Advances in Data Mining, Applications in E-Commerce, Medicine, and Knowledge Management, Springer Verlag, 15-36.
- Kohavi, R., Masand, B. M., Spiliopoulou, M. and Srivastava, H. 2002. WEBKDD 2001 Mining Web Log Data Across All Customers Touch Points, Springer Verlag.
- Koch, K. R. 1999. Parameter Estimation and Hypothesis Testing in Linear Models, Springer Verlag.
- Rawling, J. O., Pantula, S. G. and Dickey, D. A. 1998. Applied Regression Analysis – A Research Tool, Springer Verlag.
CrossRef
- Schmidt, R. and Gierl, L. 2002. Case-based reasoning for prognosis of threatening influenza waves, Advances in Data Mining, Applications in ECommerce, Medicine, and Knowledge Management, Springer Verlag, 99-107.
- Zhang, C. and Zhang, S. 2002. Association Rule Mining, Springer Verlag.
- Bengio, Y. and LeCun, Y. 2007. Scaling learning algorithms towards AI, Large-Scale Kernel Machines, MIT Press, 321-360.
- Burges, C.J.C. 2005. Geometric methods for feature selection and dimensional reduction: A guided tour, Data Mining and Knowledge Discovery Handbook: A Complete Guide for Practitioners and Researchers. Kluwer Academic Publishers.
- Dhobale, D. D., Patil, B. S., Patil, S. B. and Ghorpade, V. R. 2011. Semantic understanding of image content. Int’l J. of Comp. Sc. Issues, 8:3:2, 1694-0814.
- Khokher, A. and Talwar, R. 2011. Content-based image retrieval: state-of-the-art and challenges. IJAEST, 9:2, 207–211.
- Rudinac, S., Zajic, G., Uscumlic, M., Rudinac, M. and Reljin, B. 2007. Comparison of CBIR systems with different number of feature vector components. IEEE Int’l Work. on, Sem. Media Adaptation and Pers., 199-204. doi:10.1109/SMAP.2007.23
CrossRef
- Frigui, H., Caudill, J. and Abdallah, A.C.B. 2008. Fusion of multimodal features for efficient content based image retrieval. IEEE Intl. Conf. on Fuzzy Systems, 1992-1998.

This work is licensed under a Creative Commons Attribution 4.0 International License.
![Figure 3: A radiography (left) and the corresponding CDF curve for i∈ [0, 255]](http://www.computerscijournal.org/wp-content/uploads/2016/12/Vol09_No3_Intr_Ma_Fig3-150x150.jpg)