Identification of Abnormal Masses in Digital Mammogram Using Statistical Decision Making
Introduction
The word ‘Cancer’ is viewed with great fear and apprehension due to absence of curative medicine for perfect cure. Documentary evidences suggested the fight against cancer started 5,000 years back with Ayurvedic School of medicine. Charaka [1] and Sushrutasanhitas [2] two well-known ayurvedic classics described cancer as inflammatory or non-inflammatory swelling. According to the modern medical point of view the definition of cancer is referred to a large number of conditions or abnormal cell division which destroy surrounding healthy tissue. Most types of cancer cells eventually form a lump or mass called a tumour and are named after the part of the body where the tumours originates.
Breast cancer begins in breast tissue, which is made up of glands for milk production called lobules and ducts that connect lobules to the nipple. A malignant tumour has the ability to spread beyond the breast to other parts of the body via lymphatic and the blood stream [3]. Breast cancer is the second most type of cancer and the fifth most common cause of cancer related death. Breast cancer is rapidly growing throughout the world about one million women diagnosed with breast cancer where more than 400,000 die from it [4][5]. The scenario of developing countries is more serious, where the incident has increased as much as five percent per year [4][6] it’s due to lack of awareness and lethargy of Indian women toward healthcare.
Early and efficient detection, followed by appropriate diagnosis is the most effective way to reduce mortality. Several diagnostic imaging techniques which are an effective means of non-invasive mapping of human anatomy can be used to examine the breast. Among all alternatives, digital mammography has been proved to be the most effective and reliable screening method for early breast tumour detection. Today the use of computer technology has had an immense impact on medical diagnosis. Computer-Aided Detection/Diagnosis (CAD) is a relatively young interdisciplinary technology combining elements of artificial intelligence and computer vision with radiological image processing which the radiologist has to analyze and evaluate comprehensively in a short time. The typical application areas of CAD are to detect conspicuous structures, cost-effectively. Now a day, CAD has already become a part of the routine clinical work and used as a “second opinion” in assisting the radiologists in image interpretation.
In CAD, image segmentation is an essential step, which partitions the medical image into different non-overlapping regions such that each region is nearly homogeneous and ideally corresponds to some anatomical structure within region of interest (ROI) of breast. A grey level image consists of two main features, namely edge and region. Process of identification of sharp discontinuities within an image due to change of colour intensity is called edges. Thus intensity causes two events; geometric events i.e. discontinuity in entropy and/or colour depth and texture and non-geometric events basically direct reflection of light from other objects or same objects. Two types of segmentation is proposed here i.e. Intensity values are used to generate edge from mammogram images to differentiate regions by boundaries within breast ROI whereas similarity and dissimilarity feature is used by seeded region growing algorithm (SRGA) to differentiate the anatomical regions including abnormal region(s) by statistical decision making.
In the next section of paper a brief review has been conducted with some diverse relevant techniques proposed earlier. The third section contains proposed method, and the fourth and fifth section covers experimental results of the proposed method and discussion respectively. Final section contains the conclusion of this citation.
Previous Works
In this section, a brief review has been performed on alternative approaches proposed by different authors. The discussion is restricted in segmentation of mammographic masses, describing their main feature and high-lighting the difference among normal and abnormal masses. The key objective of the discussion is to mention methods in nut shell and in later part compare different approach with the proposed method.
Karssemeijer at al. [7] used the statistical method based on map of pixel orientations to detect the stellate distortions on mammograms. Whereas Kegelmeyer et al. [8] detected spiculated masses using local edge orientation and texture features but it is not applicable for the detection of non-spiculated masses. Comer et al. [9] and Li et al. [10] used Markov random fields to classify the different regions in a mammogram based on texture.
A fully automated method developed by Jiang et al [11], an active-contour model and special line detector is used to detect mass. Kobatake et al [12] proposed a unique adaptive filter called the iris filter to identify the mass in low contrast whereas the typical parameters are used to characterize malignant tumours. Yang et al [13] extracted masses using a probabilistic neural network (PNN) coupled with entropic thresholding technique.
Campanini et al [14] proposed a multi-resolution over complete wavelet representation. The detection of suspected mass is considered as a two-class pattern recognition problem by using SVM classifier. Whereas Rejani et al [15] proposed a four steps scheme: mammogram enhancement using filtering, top hat operation, DWT, segmentation of the tumour area by thresholding, extraction of features from the segmented tumour area and use of SVM classifier to identify abnormalities. Another SVM based approach proposed by Martins et al [16] that presented a method using the K-means algorithm and co-occurrence matrix to describe the texture of segmented structures and classified those using SVM.
The statistic based, active-contour based, adaptive filter based, neural network based, threshold based and SVM classification based approaches has been mentioned in the review. Most of the research papers have not reported the accuracy estimation of their proposed methods. In this review only those research papers are selected who clearly stated the accuracy estimation, so that, in later these can be compared with the proposed method.
Proposed Method
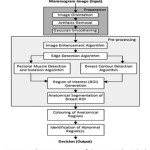
The proposed method extracts and analyzes the abnormality in digital mammogram where the input is raw digital mammogram images and output is decision regarding the presence of abnormalities. Like other conventional CAD the proposed decision-making system is divided into three sequential and distinct steps, preparation, pre-processing and statistical decision-making which is depicted in the schematic diagram (Fig. 1) of the system.
Preparation
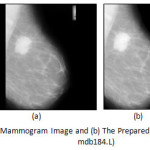
The preparation phase is needed in order to improve the image quality and make the segmentation result more accurate. It consists of image cropping, orientation, artifact removal, and denoising. Cropping the image is required to remove the non-breast background to make the algorithm efficient. The two most common mammographic projections are medio-lateral (MLO) and cranio-caudal (CC). MLO is much accepted due to its horizontal orientation whereas CC shows only the central and inner breast tissue. A standardization algorithm is required to transform the image due to this heterogeneity. Right breast needs to be flipped horizontally at 1800[17] to make the dataset homogeneous. Another additional complexity of mammogram image analysis is presence of artefacts. These artefacts provide high intensity regions on the mammogram and are inconsequential to the investigation of abnormalities within the mammogram. An algorithm [17] has been proposed to remove all such artefacts, markings on the non-breast region of the mammogram and replace them with the background colour. In this research the well-known Gaussian filter [18] is used to remove salt and pepper noises before preprocessing.
Pre-processing
The principal feature on a mammogram is the breast contour, otherwise known as the skin-air interface or breast boundary and the pectoral muscle. The breast region can be obtained by partitioning the mammogram into breast, non-breast region and pectoral muscle. On isolation of both non-breast and pectoral muscle region breast region of interest (ROI) is derived and actual processing can be done. By obtaining the breast ROI, anatomical regions are need to be differentiated and partitioned, so that, abnormal region(s) among normal regions can be identified. The input of pre-processing steps is prepared mammogram image and output is anatomical regions within breast ROI along with abnormal region(s), if present. The pre-processing phase consists of mammogram image enhancement and edge detection, isolation and suppression of pectoral muscle, contour determination, and anatomical segmentation. So, it can be said that pre-processing is an effective means for non-invasive mapping breast anatomy of a patient.
The mammogram image enhancement and edge detection are two distinct steps but here the edge detection algorithm is completely dependent on image enhancement due to use of homogeneity feature. The image enhancement and edge detection is done by determining dynamic adaptive threshold called Maximum Distance Threshold (MDT) [19]. The thresholding is constant for a particular image but varies image to image depending on intensity characteristic features. The image information i.e. intensity and its frequency is stored in a full and complete binary tree. The objective in constructing such a tree, is obtain an image with reduced number of colour, yet maintaining a full colour palette; thus achieving colour quantization at every tree level.
The pectoral muscle, a non-breast region in medio-lateral oblique (MLO) views mammograms, acts like an additional complexity for automated abnormality detection and can affect the results of image processing methods. Intensity-based methods can produce poor results due to a similar opacity of suspicious abnormalities within ROI and pectoral muscle. So, the pectoral muscle has to be isolated and suppressed before analysing the ROI. The edge based pectoral muscle isolation and suppression algorithm [20] i.e. proposed by the authors earlier is used for the same.
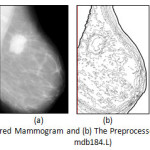
The principal feature within the breast region is the breast contour. Extraction of the breast region and delineation of the breast contour allows the search for abnormalities to be limited to the region of the breast without undue influence from the background of the mammogram. The authors published research article on breast contour detection method for mammographic images [21] which is an edge based technique to identify the outermost edge line of derived edge map of mammogram. The output of the algorithm is determined boundary which is smooth, single pixeled and continuous.
The anatomical segmentation algorithm [22] of Breast Region of Interest (ROI) is applied on Medio-lateral oblique (MLO) view of mammograms image devoid of pectoral muscle area and background delineated by breast contour. The principal idea is to differentiate the anatomical breast regions and separate each of the regions by boundary line. All anatomical regions of the breast like masses, including both non-cancerous and cancerous lesions, fat, glands, connective tissue, calcium deposits etc. appear as different shades of grey on a mammogram. The derived edge map indicates various closed structures within the breast region that corresponds to the different anatomical regions of the breast. The deliverables of earlier proposed algorithm [23] by authors is to segment out these regions on the mammogram image and erase all other unwanted edges, lines and dots from the edge map for further processing and analysis.
Statistical Decision-Making
The proposed method is to identify the abnormal feature among normal regions in breast but what and how that can be done by a decision-making system. Density, shape and size of abnormal mass is different, it leaves a unique high intensity impression in the mammogram. The decision making system is comprised of two parts, initially differentiate the regions depending on the intensity distribution using modified seeded region growing algorithm i.e. colouring of regions and finally statistical model is used to take stand regarding presence or absence of abnormality. The inputs of the proposed algorithm are mammogram image after preprocessing containing boundary outlines of anatomical regions of breast ROI.
Colouring of Regions
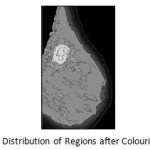
The segmentation process performed on the edge map differentiates various regions on the breast, depending on their intensity values. Each region has a different intensity value. The fatty tissues, glands, lobules and the ducts exhibit different intensity values and thus can be segregated into different regions. An abnormality such as a mass, tumours or calcifications may be present within the breast has noticeably higher intensity values than the normal tissues of the breast. So, it is needed to categorise all the obtained closed structures on basis of their intensity values. The distribution of pixels intensities also vary within each segmented region but the majority of the pixels have similar intensity values. So, the respective arithmetic Mode value is calculated for each region from the original mammogram and replaces those pixels in the region with the computed mode values. To propagate the mode value, seeded region growing technique is used. Each region, within the mammogram, is bounded by a single pixel boundary as obtained during the edge detection process followed by the process of anatomical segmentation.
During this process, the segmented image is scanned to locate region that is yet to be coloured. The scanning process starts from the first row of the image, proceeds in row major order and terminated at right most pixel of the last row. On finding the seed for a region, the colouring process is started for the region by first comparing the pixel intensity of that pixel location on the original mammogram image. For each pixel the four boundary pixels located north, east, west and south of the pixel is also checked to find out whether those are coloured or the boundary pixel. If the pixels are not coloured and not boundary pixels they again form the seed for further searching. A stack is used to store the seeds to be investigated, while a List is used to store the pixels of the regions that have been included to the region and already traversed. All the pixel positions within the List are then searched on the original image to get their intensity values to derive the Mode value. The pixel locations of each region are then substituted by the computed Mode value intensity.
Decision Making
The regions are heterogeneous in colour intensity but there is some degree of homogeneity present. The abnormal region(s) is present within these regions with some asynchronous characteristics. The objective is to extract these characteristics features to prove the presence of abnormality. To identify the abnormalities a statistical decision making system is applied to analyse the distribution of the colours domain through a step by step elimination model.
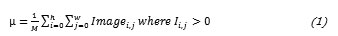
First, the arithmetic mean (µ) for the distribution is calculated to obtain the deviations of each region.
Subsequently the Standard Deviation of the dataset is calculated.
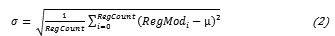
let, Regcount is number of Region is Region’s Mode vaule
Then the Z score is calculated to normalise the distribution.

The regions with negative Z values are truncated i.e. normal regions. Now the truncated mean value (Tµ) is calculated alongwith the standard deviation (Ts) from truncated data.
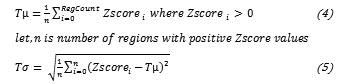
let, n is number of region with positive Zscore values
Finally, the regions are categorised into four discrete levels as per colour intensity and the 2Tσ and 3Tσ is calculated on the truncated dataset. There are some regions with colour value greater than truncated mean (Tµ) but less than truncated mean (Tµ) + Tσ level and some having greater than this but under truncated mean (Tµ) + 2Tσ level. There are few regions, their colour value beyond this level but within truncated mean (Tµ) + 3Tσ level. As per algorithm shown in look up table below, the fourth category is most suspicious , third category is mostly absent and marked as suspected region. The abnormal region is very deep grey shade whereas the suspected region(s) with grey shade marked for analysis by the medical experts. The highly dense regions are coloured with light grey shade and normal areas are demarked by white.
Table 1: Colour Lookup Table
|
Categories
|
Intensity Limit
|
Type
|
Colour
|
|
Category 01
|
< µ
|
Normal
|
White
|
|
Category 02
|
< Tµ
|
Normal
|
White
|
|
Category 03
|
< Tµ + Tσ
|
Normal
|
White
|
|
Category 04
|
< Tµ + 2Tσ
|
Dense
|
Light Grey
|
|
Category 05
|
< Tµ + 3Tσ
|
Suspected
|
Grey
|
|
Category 06
|
≥ Tµ + 3Tσ
|
Abnormal
|
Very Deep Grey
|
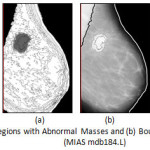 |
Figure 5: (a) Highlighted Regions with Abnormal Masses and (b) Boundary of Abnormal Regions (MIAS mdb184.L)
Click here to View figure
|
Assuming that, height and width of the image is n and m respectively, the running time of the proposed SRG will be O(n*m), if n=m then running time complexity will be O(n2). The proposed image mean value calculation will also run in O(n2). The Z score calculation and followed by truncated mean calculation will work in linearly constant time depending on number of regions present in the image. So, cumulative complexity of the method is O(n2).
Experimental Result
The proposed abnormal masses detection algorithm has been extensively tested with two well-known mammogram databases namely, MIAS (Mammographic Image Analysis Society) digital mammogram database with 322 numbers of images which is representing the 8 bit category whereas in DR / 16 bit category DEMS (Dokuz Eylul University Mammography Set) database has been considered with 485 numbers of images.
Results obtained by proposed algorithms on mammogram with absence of abnormality.
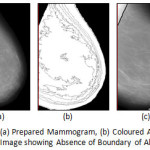 |
Figure 6: MIAS mdb272.L: (a) Prepared Mammogram, (b) Coloured Anatomical Regions and (c) Derived Image showing Absence of Boundary of Abnormal Region(s)
Click here to View figure
|
Results on MIAS and DEMS images comprised of mass (abnormality).
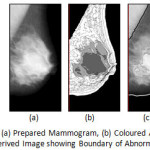 |
Figure 7: MIAS mdb028.L: (a) Prepared Mammogram, (b) Coloured Anatomical Regions and (c) Derived Image showing Boundary of Abnormal Region(s)
Click here to View figure
|
Discussion
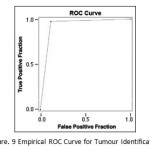
The quantitative analysis of the proposed algorithm is performed using Receiver Operatic Characteristics (ROC) analysis to measure the accuracy of identification of abnormality. Subsequently, the derived accuracy of the abnormal mass/masses detection by proposed algorithm is compared with others.
The ROC analysis has been conducted on both MIAS and DEMS mammogram database. Here MIAS database is considered as benchmark due to its clear documentation regarding classification, size, type and ground truth (GT) of images by their own radiologist. Among the 322 mammogram images, 251 mammogram images of MIAS are classified by their radiologist as normal or containing tumour(s) whereas among 251 images 207 is normal and 44 is with abnormal mass/masses. The confusion matrix i.e. Table 2 is obtained after implementing the proposed algorithm on the said 251 images to measure the agreement of proposed algorithm with available manual interpretation of database used.
Table 1: Confusion Matrix of response data reported from testing
|
|
|
MIAS Truth
|
|
|
|
Tumour
|
Normal
|
|
Proposed
Method
|
Tumour
|
39
|
5
|
|
Normal
|
5
|
202
|
From the total number of cases of 251, the number of correct detection is 241 with Accuracy value 96%, Sensitivity is 97.6%, and Specificity is 88.6%. The total positive cases missed are 5 and negative cases missed are 5. The Empiric ROC Area obtained is 0.931. The ROC curve is given below.
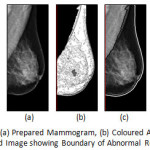 |
Figure 8: DEMS 79 LMLO: (a) Prepared Mammogram, (b) Coloured Anatomical Regions and (c) Derived Image showing Boundary of Abnormal Region(s)
Click here to View figure
|
Performance evaluation based on the size of tumour obtained by the proposed algorithm and the calculated mass size has been categorized as Table 4.
Table 1: Accuracy measures based on size of mass detected by proposed method
|
Size
|
<1.20 cm2
|
1.21 cm2 – 1.80 cm2
|
1.81 cm2 – 3.60 cm2
|
> 3.61 cm2
|
|
MIAS
|
11
|
11
|
12
|
10
|
|
Proposed Method
|
8
|
9
|
12
|
10
|
|
Accuracy
|
86.4%
|
90.9%
|
100%
|
100%
|
|
Sensitivity
|
90.9%
|
93.9%
|
100%
|
100%
|
|
Specificity
|
72.7%
|
81.8%
|
100%
|
100%
|
Near accuracy result is observed in third and fourth category due to large size of well-defined mass/masses. In case of smaller mass/masses size the accuracy decreases. For the first category three cases are missed due to their smaller size. In case of the second category the intensity for two images show a very low intensity level for the mass/masses and has merged with the adjacent regions, hence went undetected by the proposed method.
The comparative analysis is done intensively with the proposed method and other similar algorithms mentioned in the previous works section for identification of mass/masses. Most of the researchers have not shared the accuracy estimation of their proposed algorithms. Some authors have demonstrated the ways and measurements of accuracy estimation but have used different parameters to describe the accuracy of their algorithms. Mostly used parameters are Accuracy, Sensitivity and Specificity. Table 5 depicts the comparative analysis of the data gathered from these algorithms with the proposed one.
Table 1: Comparative Analysis of proposed method with others.
|
Authors
|
Accuracy
|
Sensitivity
|
Specificity
|
|
Kegelmeyer et al. [8]
|
—
|
100%
|
82%
|
|
Karssemeijer and Te Brake [7]
|
90%
|
—
|
—
|
|
Comer et al. [9]
|
100% (abnormal tissues) 58% (stellate lesions)
|
—
|
—
|
|
Li et al. [10]
|
—
|
90%
|
—
|
|
Kobatake et al [12]
|
90.5%
|
—
|
—
|
|
Yang et al [13]
|
86%
|
—
|
—
|
|
Campanini et al [14]
|
—
|
80%
|
—
|
|
Jiang et al [11]
|
66.4%
|
54.3%
|
78.3%
|
|
Martins et al [16]
|
85%
|
—
|
—
|
|
Rejani et al [15]
|
—
|
88.75%
|
—
|
|
Proposed Method
|
96%
|
97.6%
|
88.6%
|
Conclusion
The proposed decision-making algorithm is highly dependent on appropriate preparation and preprocessing steps. Accuracy of statistical decision making absolutely relies on correct segmentation of bounded anatomical regions and consequently isolation of abnormal regions among normal regions. The principle mechanism of proposed decision making is to isolate asynchronous characteristics of abnormal region(s), depends on local threshold determined by statistical analysis. The proposed method has been tested with standard mammographic databases comprising of CR and DR images of different categories. The ROC analysis suggests the algorithmic accuracy, sensitivity and specificity as 96%, 97.6% and 88.6% respectively. The false-positive (FP) and true-negative (TP) cases of mass detection are under acceptable range. In conclusion, the proposed method can be incorporated to a CAD for mass screening of abnormalities due to its algorithmic simplicity, efficiency and accuracy.
Acknowledgement
The authors are obliged to MIAS and Dokuz Eylul University for their public mammographic dataset dedicated for research and development. They also thankful to Dr. Pradip Saha, MD, Radiology for his continuous participation in proposed work and Dr. Soma Chakraborty, MD, Radiology (Specialist in Mammography) for her expert opinions and comments. The authors are also appreciative to Mr. Sanjay Nag and Mr. Sumit Das for their contribution related to algorithm development, coding and documentation of the proposed work. The authors are especially grateful to Mr. Sisir Chatterejee for his expert opinions regarding mathematical and statistical modelling related to the proposed method.
References
- Sharma, “Charaka samhita”, Varanasi -Choukhamba Orientalia, 1981
- Bhishagratha, “Sushruta samhita”, Varanasi – Choukhamba Orientalia, 1991
- Tata Memorial Hospital, website: tmc.gov.in, 2013
- Stewart et al, “World Cancer Report”, Lyon, France: IARC Press, 2003
- Ferlay et al, “GLOBOCAN 2002: cancer incidence mortality and prevalence worldwide”, IARC Cancer Base, Lyon France: IARC Press, Vol. 2, Issue-5, 2004
- International Agency for Research on Cancer Working Group, “the Evaluation of Cancer Preventive Strategies”, Handbooks of Cancer Prevention, Breast Cancer Screening, Lyon France: IARC Press, Vol.7, 2002
- Karssemeijer et al, “Detection of stellate distortions in mammograms”, The Institute of Electrical and Electronics Engineers Transactions on Medical Imaging, Vol. 15, pp. 611–619, 1996
CrossRef
- Kegelmeyer et al, “Computer-aided mammographic screening for spiculated lesions”, The Journal of Pathology, Vol.191, pp. 331–337, 1994
CrossRef
- Comer et al, “Statistical segmentation of mammograms”, Digital Mammography, International Congress Series. Amsterdam, the Netherlands, Elsevier, pp. 471–474, 1996
- Li et al, “Markov random field for tumor detection in digital mammography”, The Institute of Electrical and Electronics Engineers Transactions on Medical Imaging, Vol. 14, pp. 565–576, June, 1995
CrossRef
- Jiang et al, “Automated Detection of Breast Mass Spiculation Levels and Evaluation of Scheme Performance”, Academic Radiology, Vol. 15, Issue-12, pp. 5341-1544, 2008
- Kobatake et al, “Computerized Detection of Malignant Tumors on Digital Mammograms”, IEEE Transactions On Medical Imaging, Vol. 18, Issue-5, pp. 369-378, 1999
- Yang et al, “A Computer-Aided System For Mass Detection and Classification In Digitized Mammograms”, Biomedical Engineering applications, Basis & Communications, Vol. 17, Issue-5, pp. 215-229, 2005
- Campanini et al, “A novel featureless approach to mass detection in digital mammograms based on Support Vector Machines”, Physics in medicine and Biology, Vol. 49, Issue-6, pp. 961-975, 2004
- Rejani et al, “Early Detection Of Breast Cancer Using SVM Classifier Technique”, International Journal on Computer Science and Engineering, Vol. 1, Issue-3, pp.127-130, 2009
- Martins et al, “Detection of Masses in Digital Mammograms using K-means and Support Vector Machine”, Electronic Letters on Computer Vision and Image Analysis, Vol. 8, Issue-2, pp. 39-50, 2009
- Maitra et al, “Artefact Suppression and Homogenous Orientation of Digital Mammogram using Seeded Region Growing Algorithm”, International Journal of Computer Information Systems, Vol. 3, Issue-4, pp. 32-38, 2011
- Maitra et al, “Automated Digital Mammogram Segmentation for Detection of Abnormal Masses using Binary Homogeneity Enhancement Algorithm”, Journal of Computer Science and Engineering (IJCSE), Vol. 2, Issue-3, pp. 416-427, 2011
- Maitra et al, “A Tree based Approach towards Edge Detection of Medical Image using MDT”, International Journal of Computer Graphics, SERSC Publication, Vol-6, Issue 01, pp. 37-56, 2015.
CrossRef
- Maitra et al, “Detection and Isolation of Pectoral Muscle from Digital Mammogram: An Automated Approach”, International Journal of Advance Research in Computer Science, Vol. 2, Issue-3, pp. 375-380, 2011
- Maitra et al, “Accurate Breast Contour Detection Algorithms in Digital Mammogram”, International Journal of Computer Applications, Vol. 25, Issue-5, pp. 1-13, 2011
- Rangayyan, “Biomedical Image Analysis”, Chemical Rubber Company Press limited liability company, 2005
- Maitra et al, “Anatomical Segmentation of Digital Mammogram to Differentiate Breast Regions”, International Journal of Research and Reviews in Computer Science (IJRRCS), Vol. 2, Issue 6, pp. 1327- 1330, 2011.

This work is licensed under a Creative Commons Attribution 4.0 International License.