An Application of Moving Average Convergence And Divergence (MACD) Indicator on Selected Stocks Listed on Bombay Stock Exchange (BSE)
Aseema Dake Kulkarni1 and Ajit More
MBA , IMED ,Bharati Vidyapeeth University Pune , Maharashtra, India
Article Publishing History
Article Received on :
Article Accepted on :
Article Published : 26 Dec 2014
Article Metrics
ABSTRACT:
Technical Analysis is widely used by traders for trading decisions in the stock market especially intraday trading. Various technical indicators like the moving averages or momentum indicators assist the traders in decision making. One such trend indicator is the Moving Average Convergence and Divergence (MACD) indicator. This paper analyses the profit or loss generated on application of this indicator on selected five stocks from the Bombay Stock Exchange (BSE). It has been observed after application on a daily basis for over a year that all the decisions based on MACD have generated a profit. Certain precautionary measures have also been suggested for successful implementation of the indicator.
KEYWORDS:
Algorithmic trading; Stock market; Technical Analysis; Technical Indicators; Moving Average Convergence and Divergence
Copy the following to cite this article:
Kulkarni A. D, More A. An Application of Moving Average Convergence And Divergence (MACD) Indicator on Selected Stocks Listed on Bombay Stock Exchange (BSE). Orient.J. Comp. Sci. and Technol;7(3)
|
Copy the following to cite this URL:
Kulkarni A. D, More A. An Application of Moving Average Convergence And Divergence (MACD) Indicator on Selected Stocks Listed on Bombay Stock Exchange (BSE). Available from: http://www.computerscijournal.org/?p=1500
|
Introduction
Today what every investor needs is a technological architecture that will assist him in taking calculated risks with minimal losses. With technological advancements the needs of investors have also multi-folded. Initially a stock broking firm used to advise based on the strong knowledge base they possessed. Nowadays even stock broking firms rely on various decision making tools to safeguard the interest of investors.
The Dow Jones theory which marked the onset of technical analysis in stock markets, till today proves to be one of the best market indicators. Financial charts like the Japanese candle stick signals aid in taking stock market decisions. Technical analysis has proved to be a strong base for stock market decisions excluding the bubble burst situations.
Technical analysis has slowly matured over the years and now has taken the shape of algorithms. Algorithmic trading and High Frequency trading have taken the stock markets by storm and decisions now need are directly taken by various trading algorithms. Investment banks protect these algorithms from outsiders with tremendous caution.
The trading algorithms have affected the volatility and the liquidity in the market in a very big way. The guardians like the Securities Exchange Board of India (SEBI), Securities Exchange Commission (SEC) and other financial regulators of various nations have become more cautious with the use of trading algorithms. To ensure that the market impact of these algorithms is not potentially harmful they also need to be approved by these financial regulators in some cases. This is a precautionary measure to avoid situations like the Flash Crash that shook the US equity market in 2010[1].
Though widely used by traders to take advantage of the market movements, technical analysis is still searching for a formal academic acceptance in the financial literature. The efficient market term coined by Harry Roberts and Eugene Fama still supports the underlying assumption of rational investors. The study of Harry Roberts (1) conducted in 1959 question the technical analysis applicability leaving it to predications by chance. As opposed to this Hendrik S.Houithakker (2) proved that non-randomness does exist in the market over a period of time and trends get established. Arthur(3) created the Santa Fe artificial stock market which proved that over a long period of time decisions are taken after rational thinking but while taking quick decisions technical analysis was preferred. This resulted in a technical analysis dominated market with sudden ups and downs due to rational thinking. Alexandra Illinskaia and Kiril Ilinski (4) showed through the theory of arbitrage that market efficiency and technical analysis are time horizon dependent. Technical analysis suits the short term decisions whereas for the long term decisions the efficient market theory prevails. Most of the investors use the market inefficiencies in the short term to their benefit by exploiting them with the help of technical analysis. So it is widely used by traders.
Peter Gomber and Markus Gsell (5) have compared human traders with algorithmic trades showing a stark difference between the way the two behave and their trading approach. Archit , Kaushik and Anshul (6) have described various algorithms in their paper and have also attempted to say that large institutional investors have an advantage over small investors due to trading algorithms. This also establishes a need for protection of the small investor’s interest and shows as to why regulatory authorities like the Securities Exchange Board of India) SEBI has begun with the approval of algorithms before implementation.
Application of one of the technical indicators
Various technical indicators are used in the stock market. The technical indicator can be divided into the various categories based on the usage. The technical indicator categories are broadly mentioned below –
- Moving averages
- Price adjustment
- Volatility Indicators
- Momentum indicators
- Trend Indicators
- Market Strength Indicator
Each category will have a number of technical indicators to suit the purpose. In this research paper we have applied one of the trend indicator – Moving Average Convergence and Divergence (MACD).
Data set
Data set is the five stocks selected from Bombay Stock Exchange of India (BSE). The five stocks were selected based on the most active scrips in August 2014. Reason for choosing on this basis being that the data to be tested has to have volatility to actually analyze the impact of a trend indicator like MACD. Also automatically stocks from five different sectors get a chance of random selection.
The selected stocks were as follows –
- State Bank of India
- Tata Steel
- Force Motors
- WockPharma
- MCX
Time frame for data collection – The information about these stocks were analyzed based on data collected for the previous year i.e. 1 August 2013 to 31 July 2014.
Moving Average Convergence and Divergence (MACD)
MACD is a trading indicator, used very effectively for buy and sell decisions, created by Gerald Appel in the late 1970’s. It helps in identification for the following parameters included in a stock’s price – its direction (moving up or down)[1] , strength (by how much in monetary terms is it moving up or down), duration (the reversal of a trend).
There are three main types of oscillators – APO (absolute price oscillator) and PPO (percentage price oscillator) and DPO (detrended price oscillator). MACD falls in the first category as it deals with actual prices of moving averages rather than percentage changes.DPO ignores long term trends as focuses on short term patterns. MACD does not fall in this category as it is term independent.
MACD uses the EMA (Exponential Moving Average) rather than the SMA (Simple Moving Average) which is more effective. EMA considers data over a period of time whereas SMA calculates the straight average of the data. By comparing EMAs of different lengths the MACD series gauges changes in the trend of a stock.
The MACD indicator is calculated as the difference between the fast and slow moving averages:
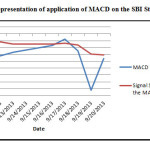
MACD = 12 Day exponential moving average – 26 Day exponential moving averageThe signal line is calculated as a 9 day exponential moving average of MACD.
The decision making signals :
Chart : Buy: This is signaled by the MACD crossing above the Signal
Sell: This is signaled by the MACD crossing below the Signal
Excel
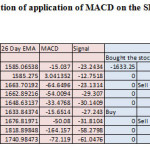
A formula based version was used for calculation and discussion as discussed below. The spreadsheet application Microsoft Excel (belongs to the Microsoft Office Suite) was used for this purpose.
As seen above the excel sheet with the calculations for one of the stocks has been showcased for representation purposes. With the help of the 12 day and 26 day EMA , the MACD has been calculated and with the 9 day EMA the Signal line has been calculated. The SBI stock was bought on 6 September 2013 at the closing price of Rs.1633.25. The stock will not be bought or sold if the MACD is negative indicating a bearish signal. In case the MACD is positive then only a buy or sell signal will be generated. For a buy signal today’s MACD should be greater than today’s signal AND yesterday’s MACD should be less than yesterday’s signal. Exactly the reverse should exist for a sell signal to get generated. The buy and sell signals were generated for the whole year.
Final Result after the application
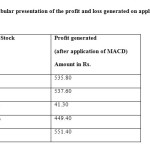
After considering the buy and sell decisions the profit and loss was generated. The profit and loss for the five stocks is tabulated below –
Based on the above table it was seen effectively that application of the MACD indicator does generate profit. In case the investors wants a profit at a particular level then an additional indicator can be included which shall make sure that if the stock price goes down beyond a particular level then the stock should be sold immediately to capture the price.
Limitations
Though MACD generates profit, sometimes it can also generate false indicators. Especially when a stock is overvalued the mechanism might not work as expected. A solution for this problem being the fundamental analysis should be done of the stock chosen for application of the MACD indicator. All the above five stocks have strong financial fundamentals and so the MACD worked with perfection. Also bubble bursts can impact the application. As a precautionary measure a stop loss mechanism should be included. The MACD indicator would prove extremely useful for trading decisions with precautionary steps taken for loss minimization.
Conclusion
Back testing of any trading strategy is necessary. It helps in adding certain features to the trading strategy that are necessary. The trading strategy should be modified based on the needs and requirements of the investors. Unrealistic modifications may not be feasible but surely realistic modifications can add a certain added value to the stock market. With precautionary measures taken, technical analysis should be used for short term decision making. The MACD indicator does offer investors the ability to generate profits by stock market investment.
References
- Roberts,H.,Stock Market Patterns and Financial Analysis : Methodological Suggestions , Journal of Finance 14,pp 1-10,1959
- Houthakker,H.,Systematic and Random Elements in Short Term Price Movements,American Economic Review 51,pp.164-172,1961
- Arthur, W.B.J.H.Holland,B.LeBaron,R Palmer and P.Tayler,Asset Pricing under Endofenous Expectations in Artificial Stock Market,The Economy of Evolving Complex System II Eds. Arthur Durlauf and Lane SFI Studies in the Science of Complexity, vol XXVII, Addison-Wesley,pp12-44,1997
- Illinskaia A. and K.Illinski, How to Reconcile Market Efficiency and Technical Analysis,http://xxx.lanl.gov/abs/cond-mat/9902044,1999
- Gomber Peter ,Gsell Markus “Algorithmic trading engines versus human traders: Do they behave different in securities markets?”CFS Working Paper, No. 2009/10 Provided in Cooperation with: Center for Financial Studies (CFS), Goethe University Frankfurt (2009)
- Archit Bansal , Kaushik Mishra , Anshul Pachouri “Algorithmic Trading (AT) – Framework for Futuristic IntelligentHuman Interaction with Small Investors, International Journal of Computer Applications (0975 – 8887) (2010)
- Book by Ernest P Chan, Quantitative Trading , Wiley Trading
- Book by Kevin.S on Securities Analysis and Portfolio Management by PHI Learning
- http://www.thehindubusinessline.com/markets/sebi-rules-out-ban-on-algorithmic-trading-system/article2671138.ece [Accessed on 29 June 2014]
- http://www.business-standard.com/article/markets/high-tech-algo-trades-pick-up-114061001132_1.html [Accessed on 31 August 2014]
- http://www.quantstart.com/articles/Successful-Backtesting-of-Algorithmic-Trading-Strategies-Part-I [Accessed on 23 October 2014]
- www.economictimes.com [Accessed during January 2014 to November 2014 regularly for updations in the area of stock market]
- www.ft.com [Accessed during January 2014 to November 2014 regularly for updations in the area of stock market]

This work is licensed under a Creative Commons Attribution 4.0 International License.