Dr. Saad Talib Hasson1; Jullanar Ali Al-Motairy1 , Luay Habeeb Hashim1, Zainab Saad Talib 2 and wurood mahdi sahib 1
1University of Babylon; Iraq
2 University of Kerbala Iraq
Article Publishing History
Article Received on :
Article Accepted on :
Article Published : 07 Jul 2014
Article Metrics
ABSTRACT:
Computer Simulation and Modeling techniques were used successfully to represent and propose an Optimum resource allocation problem in many field and applications. In wireless communication networks these techniques can be applied in the field of developing and controlling the available paths, power control, coverage area, delay, and delivery guarantee.
In this study the main objective function is to indicate the optimum location of the wireless network stations to maximize the throughput, minimize delay, reduce path loss information, increase the coverage area and minimize the total network costs. The network performance must not exceed the limitation constraints under the required feasible standard quality of service.
The modeling results showed good indications and gave a suitable guide to build, extend or develop such networks.
KEYWORDS:
Selecting; Computer Simulation ; Modeling techniques
Copy the following to cite this article:
Hasson S. T, Al Motairy J. A, Hashim L. H, Talib Z. S, Sahib W. M. Selecting the optimal location of wireless communication network Stations. Orient. J. Comp. Sci. and Technol;7(1)
|
Copy the following to cite this URL:
Hasson S. T, Al Motairy J. A, Hashim L. H, Talib Z. S, Sahib W. M. Selecting the optimal location of wireless communication network Stations. Orient. J. Comp. Sci. and Technol;7(1). Available from: http://computerscijournal.org/?p=748
|
Introduction
The wireless Mobile communications plays a crucial rule in human lives. It helps to communicate and exchange information regardless of looking for the distance between the communicated persons.
Technology was developed in an explosive manner so that it attracts users to change their equipment and start using new services. current systems were concentrated more on user’s expectations and needs some new technologies are being developed and tested which are expected to measure and estimate the suitable design of the coverage area. These technologies are depending upon towers height, sub-station distances and directions. It may also depend on the usable transmission power with the designed angle of transmission. The mobile technology are expected to meet the multi-objective function ,by improving the services ,coverage area and finally reduces the total construction and operation costs by estimating the optimal required number of mobile stations to cover certain area.
Elements of a wireless network
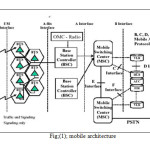
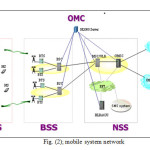
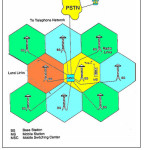
The wireless communication networks contain many elements. These elements represent the all required components and equipment’s required to complete the work and serve the calls in a suitable manner. Figure (1) and figure (2) shows the main elements of the mobile network as a representation of wireless network from different point of views [F. Glover et al., 1992; Jim Kurose et al., 2004].
Wireless Network Configuration
One can apply the queuing approach to model the traffic in telecommunication networks which can be expressed in terms of calls that made between a large numbers of origin-destination pairs during a particular period of time. Usually calls between origins and destinations may be routed along any path through the network can be formulated as a mathematical model with an objective function of improving the communication service and the constraints are subject to the capacity limitations, area covered, towers distribution and heights [David Julian et al., 2001; Ghani 2004], as shown in fig (1) and fig (2).
In such networks, transmission lines are always used to carry traffic in the form of certain kinds of signals such as calls and messages. These lines form the link between switching-stations. Traffic usually routed from one switch-station to the next until it reaches its final processing with the destination station. For the mathematical representation and to simplify the graphical representation we will assume both the origin and destination of a call to be as a switch-station.
In graphical representation each switch-station is represented as a node in the network, and each link between any two nodes is represented as an arc. The maximum amount of traffic that can go through a switch-station during a specific period of time will be referred to as node capacity. A similar definition holds for arc capacity. A route from origin to destination through the network is a path. Traffic process for a particular origin-destination pair can be modeled using available network representation techniques. Simulation model will be developed in a possible manner to imitate the overall process and to discuss effect of any suggested variable [M. Chiang et al., 2001].
Mobile communication
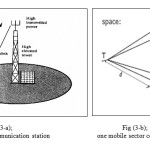
In the general operation strategy of mobile stations one can observe that each mobile uses a separate, temporary radio channel to talk to the sell site. The sell site has an ability of talking to many mobiles at once. In many communication protocols the system was designed to use one channel per mobile or Channels use a pair of frequencies for communication. Due to the fact; Radio energy dissipates over distance, so mobile must stay near the base station to maintain communication. Figure (3) shows the basic structure of mobile network includes telephone system and radioservices [Fred Baker 2000].
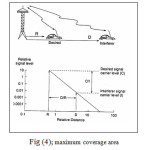
directions [ITU-R 2007; Jaka Sodnik et al., 2008]. In figure (4) a maximum coverage area was indicated with al its parameters estimation calculations.
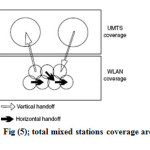
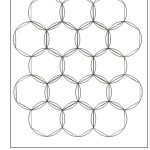
Figure (5) [Lu,W.-W 2003] shows the mixed total coverage area of many mobile stations which can be estimated and modeled in an optimal manner to find the suitable accurate position of each station in order to maximize the total coverage area and minimize the total required number of stations with certain transmission power and frequency ranges.
Problem description
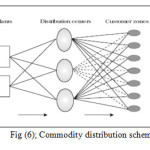
Due to the integration among communications engineering, computer science, mathematical foundations, probability and statistics, queuing theory and other random walk techniques, we will try to develop a mathematical model to represent one view of A commonly occurring problem in distribution system design which is the optimal location of intermediate distribution centers (or sub stations) in all levels between central service stations and customer zones [Charnes et al., 1955; E.M.L. Beale et al., 1969;B.Golden et al., 1977]. These intermediate facilities (temporarily) store a large variety of commodities that are later shipped to designated customer zones. This will help in reduce the total construction and maintenance cost. Figure (6) shows a simple Commodity distribution scheme for mobile network stages.
Decisions must be made depending on the available allocation techniques to facilitate the location of each type of mobile stations. While solving this problem the designer will able to determine which distribution centers should be selected, and what customer zones should be served by the selected distribution centers. The optimum solution is clearly dependent on the pattern of transportation flows for all commodities assuming that the signal to noise ratio is good and the used bandwidth is better [F. Glover et al., 1992; AIMMS 2008].
Modeling proces
The most important thing in mobile communication network was the following general equation: [Wan, K .L. Y et al., 2000]
C = B * log2 (1 + S/N)
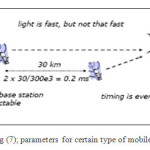
To enter the first state of our building steps we will discuss the available required formulas. Some of these formulas were indicated in figure (7) and other examples below. Figure (7) shows a designed allocation parameters for certain type of mobile stations which may be differs from our suggested general allocation problem. Any distances and ranges indicated in this figure represent the original designed source.
The mathematical model described in the following qualitative formulation consists of objective and the constraints [N. Bambos 1998; M. Chiang et al., 2001].
The objective function is to:
Minimize
the total cost by reducing the production, service and transport costs by reducing the total mobile station numbers.
Subject to following constraints:
- Transport must be less than or equal to available supply.
- Distribution centers must cover all customer zones.
- Transport must be greater than or equal to required demand.
- Throughput must be between specific bounds, and
- Supply must come from exactly one distribution center.
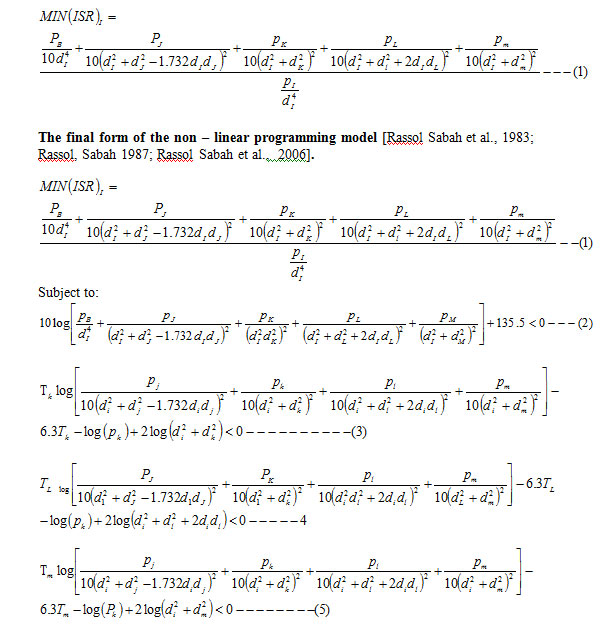
The following nonlinear problem of optimizing node powers to maximize SIR for a particular user under quality of service constraints for other users in a cellular network is a convex optimization problem [David Julian et al., 2001].
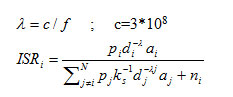
The following mathematical model of minimization interference to signal ratio (ISR) was presented by others to certain model with 5 cellular communication stations. [S. Lal et al., 1999]. This model objective is to optimize the mobile transmitted power to minimize the interference to signal ratio for a particular user under quality of service (quality operating system) constraints in the cellular communication network. The model solution will help in the optimal distribution of mobile station.
The suggested five users are noted as (I, J, K, L, M) [Rassol Sabah et al., 2006]. The objective function is to minimize the ISR. Such objective function can be written in the following form [Bazarra mokhtar 1979;Rassol Sabah et al., 2006]: MIN (ISR)1.
Allocation problem formulation
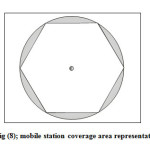
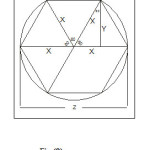
We will formulate the coverage area of each mobile station (tower) as shown in figure (8), as circle with certain diameter depending on the transmission range. In mobile communication the coverage area was modeled as hexagon [C. A. Haverly 1978].
If we have many stations required to cover certain zone. The zone area can be estimated using available developed techniques or maps. The number of required towers or sub stations to cover this zone will be the total zone area divided by hexagon or circle area. The following example indicates the required calculation to perform the suitable performance.
Example
To calculate the coverage area of a mobile station and its estimated representation we will develop the following example; in this example we will compare the circle area with the hexagon area calculations.
If we have a maximum coverage area diameter to be X= 4141 m as calculated from the above model [Rassol Sabah et al., 2006].
The coverage area of the resulted circle will be
A =
The hexagon area will be calculated as follows
X= 4141 m
The hexagon can be divided into six triangles
As shown in figure (9).
The triangle area is calculated as follows:
Y= sin 60 * x
The Area of triangle = 0.5 * x * y
The Area of hexagon = The Area of triangle * 6
The Area of circle = x2 * 13.4
The error ratio = The Area of circle – The Area of hexagon
Calculation
y=3586.211 m
The Area of triangle = 7425250.2 m2
The Area of hexagon = 44551501.7 m2
The Area of circle = 229781605.4 m2
The error ratio = 185230103.7 m2
If we have certain zone area we will be able to calculate the optimum number of stations required to cover this zone area by dividing the zone area by the hexagon area [Fred Baker 2000].
Conclusion
After applying our suggested techniques, one can develop a very suitable algorithm that helps in indicating the optimal required number of mobile stations with their locations to cover the designed area with minimum possible cost with out affecting the services and meet all the customers’ requirements.
The combination of the architectural modeling and analysis technique, together with the system operation and defect classification, cost-framework, and the reliability models of individualcomponents and the overall system, comprise a comprehensive methodology which may be evaluated on a future series of case studies applications. These applications of modeling dynamic component behavior of wide area computer and communications applications will results in a more detailed view of the component. The deficiencies associated with static behavior modeling have led to a group of component modeling techniques and notations.
References
- AIMMS. Optimization Modeling. July 28, 2008.Paragon Decision technology B.V.
- B. Golden and T. Magnanti, Deterministic network optimizations: A bibliography, Networks 7 (1977), 149–183.
CrossRef
- Bazarra, mokhtar s ;( 1979); “Nonlinear Programming”, 1st ed., Jojn Wiley and Sones.
- Charnes and W.W. Cooper, Generalizations of the warehousing model, Operations Research Quarterly 6 (1955), 131–172.
CrossRef
- C.A. Haverly, Studies of the behaviour of recursion for the pooling Problem, ACM SIGMAP Bulletin 26 (1978).
- David Julian, Mung Chiang, Daniel O’Neill and Stephen Boyd. And Fairness Constrained Convex Optimization of Resource Allocation for Wireless M. Andersin, Z. Rosberg, and J. Zander, “Gradual removals in cellular PCS with constrained power control and noise.” Wireless Networks, 2(1):27-43.2001.
- E.M.L. Beale and J.A. Tomlin, Special facilities in a general mathematical programming system for non-convex problems using ordered sets of variables, Proceedings of the 5th International Conference on Operations Research (Tavistock, London) (J. Lawrence, ed.), 1969.
- Fred Baker, Cisco Fellow. Network Improvements for A. Debby Nahl, Fall. GSM – GLOBAL SYSTEM FOR MOBILE COMMUNICATION.2000.
- F. Glover, D. Klingman, and N.V. Phillips, Network models in optimization and their applications in practice, John Wiley & Sons, New York, 1992.
CrossRef
- Ghani, S. A, S., (2004), “Optimal Allocation of Cellular Base Station”, M. Sc. Thesis, University of Technology.
- Jaka Sodnik, Mitja Stular. Mobile Communications: 4G. 2008.
- Jim Kurose, Keith Ross, Wireless and Mobile Communication Networks, Addison-Wesley, July.2004.
- Lu, W.-W. Open wireless architecture and enhanced performance. IEEE Commun. Mag. 2003, 41 (6), 106–107. CrossRef
- M. Chiang, D. ONeill, D. Julian, and S. Boyd, “Resource allocation for QoS provisioning in wireless ad hoc networks.” Proc. IEEE Globecom, San Antonio, TX, Nov. 2001.
- N. Bambos, “Toward power-sensitive network architectures in wireless communications: Concepts, issues, and design aspects.” IEEE Personal Communications Magazine, 5(3):50-59, 1998.
CrossRef
- Rassol, Sabah, Kazuhiro and Ohdate, Hitohi; (1983) “optimal channel reuse in cellular mobile radio system” IEEE Transaction on Vehicular Technology, Vol.34. no.1, February 1983.
- Rassol, Sabah. .Y. (1987), “A computer Simulation model for the Evaluation of mobile radio system in the Military Tactical Environment” IEEE Transaction on Vehicular Technology, Vol. VT. 32. No.2 May 1987.
- Rassol, Sabah; Abd salam, Saad. “Optimal Distribution of Cellular Station”, 2006.almansor University.\
- S. Lal and E. Sousa, “Distributed resource allocation for DS-CDMA based multimedia ad hoc wireless LAN’s.” IEEE J. Sel. Areas in Communications, 17(5):947-967, May 1999.
CrossRef
- ITU-R. Radio communication Sector, http://www.itu.int/ ITU-R (accessed July 12, 2007).
- Wan, K .L. Y. and Tak-shing, P. Y.; (2000); “Fixed Channel Assignment Optimization for Cellular Mobile Networks”; IEICE Transactions Commun. 9 Vol 83-B, No.8 August 2000.

This work is licensed under a Creative Commons Attribution 4.0 International License.