A Systematic Literature Survey on Various Techniques for Software Fault Proneness
Prerna Jain* And Balraj Singh
Department of Computer Science Engineering, Lovely Professional University, Punjab - 144 402, India.
Article Publishing History
Article Received on :
Article Accepted on :
Article Published : 05 Jul 2014
Article Metrics
ABSTRACT:
Fault proneness prediction of a software module having a great role in the quality assurance. Faults proneness prediction is to find the areas of the software which have a greater impact. In today’s world it is becoming a big issue to find the fault prone modules. Faults are the flaws in the software that can cause a failure. Most of the failures are in the small parts of the software modules. Testing of the fault prone modules again and again after resolving the fault decreases the testing cost and effort as compared to test the whole module after resolving the fault again and again. The primary goal of this research paper is to analyse the techniques of fault proneness of the software module.
KEYWORDS:
Fault proneness
Copy the following to cite this article:
Jain P, Singh B. A Systematic Literature Survey on Various Techniques for Software Fault Proneness. Orient. J. Comp. Sci. and Technol;7(1)
|
Copy the following to cite this URL:
Jain P, Singh B. A Systematic Literature Survey on Various Techniques for Software Fault Proneness. Orient. J. Comp. Sci. and Technol;7(1). Available from: http://computerscijournal.org/?p=714
|
INTRODUCTION
Fault prone modules prediction is an important area in the software engineering. Constraints and the complexity of software are increasing day by day. Due to which it is very difficult to produce software without faults. Risk management also can be done by the early identification of the fault prone software modules.
First of all it is must to know about the basic terms error, fault, and failure. Error is the mistake caused by the human being. Fault is the flaw which can cause failure in the software. Failure is the deviation of the actual behaviour of the software from the expected one. Fault proneness is the likelihood of a piece of software to have faults.
If faults are detected in the early phases of the software development then it can decrease the cost and time of development. If fault prone modules are detected in early phases then planning and performing testing on fault prone parts of the design and code can be done according to the need. Testing of the fault prone modules is planned according to the resources available. It will also increase the quality of the software. It will also increase the customer satisfaction. Due to fault prone modules development and maintenance costs can be increased.
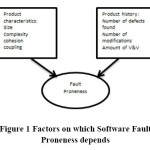
Fault proneness depends on the two factors of product. These factors are product characteristics and product history. A product characteristic consists of size, complexity, cohesion and coupling of the product. Product history consists of number of defects found, number of modifications done and amount of V&V (verification and validation).
Fault proneness of software modules can be checked by various methods. Methods for finding the fault proneness of modules are neural network, K-mean clustering, logistic regression, statistical and machine learning methods, CK metrics.
TECHNIQUES FOR FAULT PRONENESS OF SOFTWARE MODULES
K-Mean clustering technique: K-mean clustering technique is used to divide n observations into k clusters upon the basis of mean of the cluster. It is very difficult to decide the correct mean value of the cluster. K-mean clustering is faster than hierarchal clustering only if K is small. It may happen that K-mean clustering produces tight clusters than hierarchal clustering. It is used to classify the fault proneness of software modules.
metrics suit which is used for the object oriented design is known as CK metrics. CK metrics includes six metrics and these metrics are lack of cohesion on methods, weighted methods per class, depth of inheritance tree, number of children, coupling between object classes and response of a class.
logistic regression is used to find the faulty modules in software. LR is used to predict dependent variable from the set of independent variables. There are two types of LR- univariate and multivariate. Multivariate LR is used to construct a prediction model for the fault proneness of models.
- Artificial Neural network
ANN is usually used to model complex relationships between inputs and outputs, to find patterns in data, or to capture the statistical structure. It helps to predict faulty modules. Results of this method are very accurate. It decreases effort and cost of developing software.
(R.Sathyaraj, S.Prabu, 2013) In this work they suggest that to improve the quality it is essential to find the error or fault as quick as possible. Software fault prediction is the most efficient methodology ever to improve the quality of the products. Here to determine and advance the development of product there are number of prediction approaches are available. They compared different prediction models and proposed the methodology with the datasets they used for easy understanding. It shows the variety of methods and the metrics used to improve quality of the object oriented software. Software fault prediction using different techniques to improve the quality and the error free software delivery. This work gives overview about the prediction models for software in design and implementation phase. It discuss trends which are currently used software fault prediction.
(Liguo Yu1 and Alok Mishra, 2012)
Here work is done in studying how to effectively use the complexity metrics and theprediction models under realistic conditions. Complexity metrics have been intensively studied in predicting fault-prone software modules. Here it present a study showing how to utilize the prediction models generated from existing projects to improve the fault detection on other projects. In order to improve model prediction efficiency we can selection of source datasets and the determination of cut-off values should be based on specific properties of a project. It shows, models generated using more datasets can improve the prediction accuracy but not the recall rate and lowering the cut-off value can improve the recall rate, but this process number of false positives will be increased, which will result in higher maintenance effort.
(Amjan.Shaik, Dr.C.R.K.Reddy & Dr.A.Damodaram, 2012)
To assess the fault proneness of object oriented software, Mediated class relations and method calls as a confounding factor on coupling and cohesion metrics. Here new cohesion and coupling metrics labelled as mediated coupling and mediated cohesion proposed. Here measures are differing from the majority of established metrics in two respects like they reflect the degree to which entities are coupled and they take account of mediated relations in couplings. The comparison of new measures with eight established metrics is shown. The new measures are describes to be consistently superior on the fault proneness.
(Mishra & Shukla, 2011)
analysed the impact of attribute selection in finding the defects in OO software. They find the impact of the attributes on the NB model. They had used the ecllipse and KC1data sets to find the results. They had found the 88% probability of detection anf 49% false alarm rate. Firstly, they fonud the impact of attributes of the ecllipse data set on the complexity metrics. Then they found the attributes from the KC1 dataset which give the good results. In their research they had sed the 10 cross validation experiments with the attribute selection techniques. For finding the impact of the ecllipse attributes they calculated the true positive rate, false positive rate, precision and F-measure. In the case of KC1 dataset they had calculated the true positive rate, false positive rate, priecision and F-measure. For the selection of attributes in ecllipse dataset they had performed IG_1 to IG_11 based on information gain and COV_1 to COV_3 based on covariance metric and in the case of KC1 dataset they had performed IG_1 to IG_6 based on information gain and COV_1 to COV_6 based on attrute relationship.
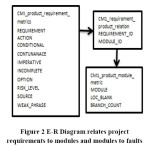
(Parvinder, Amanpreet, Raman, Jagdeep, Sanyam, 2010)
analysed that the requirement metrics and code metrics can be used to detect the faults in the early lifecycle. They have used the decision tree based model and K-mean clustering technique. They have performned their experiments on the CM1 real time defect datasets of NASA software projects. Code metrics and requirement metrics were combined by the inner join database operation. Data was divided into two parts by using the clustering technique known as K-mean clustering as fault free and fault prone data. Confusion metrics was used to find out the results that the data is faulty or not. PD and PF were used to find out the results in confusion metrics. After experiments decision tree was made based on the risk level metric. Then decision tree was evaluated with the 10-fold cross validation technique. After finding the results ROC curve was also made. With the proposed model results found are very impressive.
(Partha & Vandana, 2012)
they compared the effectiveness of Quad tree-based k-means algorithm with k-means algorithm topredict the faulty software modules. It is very difficult to find clusters. These clusters were the input to the k-means algorithm. To solve this difficulty researchers used the quad trees. Clustering technique is used to find that the clusters which were made by the quad tree are of good quality or not. Quad tree based algorithm is used to find the faulty software modules. Quad tree based algorithm gives better results than the original k-means algorithm. They used the concept of buckets to divide the data. Then found the centres of clusters. They used four real data sets to perform experiments named as AR3, AR4, AR5 and Iris data set. They used the confusion metrics to find that the software module is faulty or not. Evaluation parameters used by them were FPR, FNR, Error and Precision. For the comparision of quad tree based k-means algorithm with the k-means algorithm used some techniques like QDK etc.
(Luo & Ben, 2010)
discussed that metrics are very useful to find that which module of a software is more prone to fault and which are less. They used the correlation analysis and grey relational analysis to select the metrics. They also used the NaïveBayes, logistic regression model and J48 to check that which module of a software is more prone to fault. They used only one data set to check the results of the proposed model. Firstly, they found that it is beneficial to use KC3 data set. Then correlation analysis is used to find the metrics having high correlation. After that they had used the grey relational metrics for ranking the remaining metrics which are having low correlation. Then for the results that selected metrics are useful or not they have used the regression and machine learning methods. Accuracy, precision and recall for checking the performance of the proposed model. For the comparision of the proposed model they choose random method for NaiveBayes, logistic regression and J48 model. For the random method they have choose random metrics. They found that proposed model is better than random model.
(Dr.Parvinder, Manpreet, Amandeep, 2010)
proposed a model based on the requirement and code metrics. They also done comparision of fusion model with the mostly used code model and found that fusion model is better than code based model. Fusion model also increases the productivity. Firstly they found the code for the evaluation of model and requirement attributes of the software system. Data set that is used is known as metric data program. Then select the suitable metrics for the model. Then they combine the requirement and code metrics by inner join database operation. Then find the algorithm which is beneficial to use to found the faulty and non-faulty components of the software. Then implementation of model is done by using the confusion metrics. For the measurement of the performance of the metrics accuracy, probability of detection, probability of false alarm, precision attributes are uesd.
CONCLUSION
In this paper, various techniques are defined to predict the fault proneness of a software. Some models are also defines in this paper which helps to find the fault proneness of a software which uses the techniques which are defined. Fault proneness found of the software is used to define the quality of the software. It also helps in easy development of the software, reduces cost, development effort etc.
REFERENCES
- Amjan, Dr.C.R., Dr.A., “Impact of Mediated relations as Confounding Factor on Cohesion and Coupling Metrics: For Measuring Fault Proneness in Oo Software Quality Assessment,” Global Journals, 2012. [2] B., K.K., “Impact of attribute selection on defect proneness prediction in OO software,” IEEE, 2011
- Dr.Parvinder, Manpreet, Amandeep, “a density based clustering approach for early detection of fault prone modules,” IEEE, 2010.
- Liguo, Alok, “Experience in Predicting Fault-Prone Software Modules Using Complexity Metrics,” QTQM, 2012.
- Luo, Ben, “metrics selection for fault proneness prediction of software modules,” IEEE, 2010 [6] Partha, Vandana, “software fault prediction using quad tree based K-Means clustering algorithm,” IEEE, 2012.
- Parvinder, Amanpreet, Raman, Jagdeep, Sanyam, “a model for prediction of faults in software systems,” IEEE, 2010.
- R.Sathyaraj, S.Prabhu,” A survey – Quality based Object Oriented Software Fault Prediction,” IJET, 2013.

This work is licensed under a Creative Commons Attribution 4.0 International License.