O.S. Ogunseye¹, O. Folorunso¹, J.O. Okesola² and J.R. Woodward³
¹Department of Computer Science, University of Agriculture, Abeokuta (Nigeria).
²Department of Computer and Information Science, Tai Solarin Univeristy of Education, IJebu-Ode (Nigeria)
³Department of Computer Science, University of Nottingham (UK).
Article Publishing History
Article Received on :
Article Accepted on :
Article Published :
Article Metrics
ABSTRACT:
E-voting is said to have a lot of loop holes. Solving these problems first starts with their definition as either technical or procedural. In this paper we look at the problem from the procedure perspective and we identify some issues that previous models do not cater for. The model we proposed allows for high-level monitoring of the balloting process and takes advantage of the semantic search process to ensure security of the e-voting procedures through over-the-board authentication . The model also solves the old problem of recounting of the ballots/votes.
KEYWORDS:
Visual Analytics; Sematic Search; Natural Language Processing; E-voting; Machine Learning
Copy the following to cite this article:
Ogunseye O. S, Folorunso O, Okesola J. O, Woodward J. R. The EVAS Model: Solving E-Voting Problems in Nigeria. Orient. J. Comp. Sci. and Technol;3(2)
|
Copy the following to cite this URL:
Ogunseye O. S, Folorunso O, Okesola J. O, Woodward J. R. The EVAS Model: Solving E-Voting Problems in Nigeria. Orient. J. Comp. Sci. and Technol;3(2). Available from: http://www.computerscijournal.org/?p=2282
|
Introduction
Electioneering is the process used by most countries of the world to select their desired leaders minor or major. The accuracy of the voting process cannot be therefore overemphasized. So far the age long offline method of voting – using paper, has been hunted by spells of corruption and rigging. This fact has not dispelled its use as against the newer e-voting because of the seeming general belief that it is the lesser evil of two demons (Rubin, 2010). Despite the apprehension and doubts, e-voting has however been very useful in elections conducted in some major countries of the world.
E-voting recorded success in the US (Steve, 2004) , Brazil (Whitney, 2000) and India (Habib, 2004) to mention just a few. These successes do not in any way change the fact that e-voting can be prone to major security issues. Some of these security issues were discussed by Rubin (2010) where he presented them from the application user’s or technology perspective. He showed that there are many ways an attacker can attack the system using malicious software. Balzarotti et al (2008) also showed that problems can arise from poorly developed systems leading to major irregularity in the results of an election.
Another reason for e-voting’s lack of popularity is the lack of capacity for recounting of votes in event of the results been challenged. This has been the major point that has been used against e-voting even where it would have been successful. Following Xenakis and Macintosh(2004), the problems with e-voting should be seen from two perspectives: technical and procedural. Many of the problems relating to the system design and network structure are classified under the technical and considered to be pervasive and not unique to e-voting or the electioneering process.
The other issue of procedure affects howthese technology is used to rig and thwart election efforts without faults been directly ascribed to the system in particular. For thisreason Xenakis and Macintosh(2004) proposed the monitoring of the procedure of the e-voting process as a viable solution. Folorunso et al (2010) showed the success and positive effect of monitoring election process through the use of tree-map visualization. It is however obvious that a simple monitoring of the e-voting process from tree-map visualization will not be enough especially when the fact that people have found ways of beating the system even before the election day is put into consideration Clinton(2009). if a secure procedure is to be achieved and if e-voting is to ever be useful then smarter measures must be put in place to ensure a more effective monitoring (i.e. in the event of a secure technical process). In this paper, we present a strategy for improving the security of e-voting through interactive visualization of intelligent data. The use of Natural Language Processing based semantic analysis is to ensure recounting in the event of the need and improve authentication. We believe that this novel conceptualization can help greatly reduce the insecurities of the e-voting procedure and in no small measure increase its usage.
Material and Methods
Visualizations leverage the human visual system to support the process of sensemaking, in which information is collected, organized, and analyzed to generate knowledge and inform action (Jeer and Agrawala, 2008). it is usually classified into two types: Scientific visualization and Information Visualization. Scientific is an interdisciplinary branch of science according to Friendly (2008) “primarily concerned with the visualization of three dimensional phenomena(architectural, meteorological, medical, biological, etc.), where the emphasis is on realistic renderings of volumes, surfaces, illumination sources, and so forth, perhaps with a dynamic (time) component. Information visualization is the interdisciplinary study of “the visual representation of large-scale collections of non-numerical information, such as files and lines of code in software systems, library and bibliographic databases, networks of relations on the internet, and so forth”(Friendly, 2008). Visual Analytics is a partial fusion of information visualization and Scientific visualization. It was defined by Thomas and Cook (2005) as “the science of analytical reasoning facilitated by visual interactive interfaces.” . Visual analytics is a relatively new field that integrates new computational and theory-based tools with innovative interactive techniques and visual representations to enable human-information discourse (Wong and Thomas, 2004). Wong and Thomas (2004) prescribed visual analytics as a good way to monitor and prevent threat and invariably improve security in systems. They also posited that it can provide the bedrock for analytical reasoning through which an analyst can apply human judgments to reach conclusions from a combination of evidence and assumptions. They stipulated that for a visual analytics tool to be efficient it must enable diverse analytical tasks such as:
üUnderstanding past and present situations quickly, as well as the trends and events that have produced current conditions
üIdentifying possible alternative futures and their warning signs
üMonitoring current events for emergence of warning signs as well as unexpected events
üDetermining indicators of the intent of an action or an individual
üSupporting the decision maker in times of crisis.
In the development of a visual analytic tool for e-voting, These concerns are addressed.
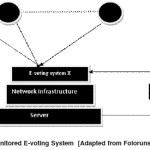
Overview of the Current Monitored E-voting System
In figure 1, For each individual or corporate user U that votes, the data is transferred to a remote server through a network. The visualization tool we designed in Folorunso et al (2010) resides on the server and monitors events as they occur from the e-voting systems which can be from 1 to x. The monitoring tool in this model is a tree-map visualization system called TEMS (Tree-map E-voting Monitoring System).
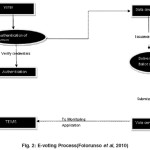
The voting takes place as follows:
- Stage 1: Pre-voting Registration Each Potential voter is registered at different locations in the country and data is taken from them and stored on the a central server system.
- Stage 2: Voting
Step 1 The potential voters assemble at various locations closest to them and enter their voting details {usually their names and a thumb print} in an e-voting system.
Step 2 The system crosschecks their data with the data collected in the pre-voting registration to see if it is consistent.
Step 3 If consistent the ballot is issued and the voter can vote Else the voter is denied access to ballot.
Step 4 The TEMS helps to see if there is any glaring fault in software and visualize the e-voting results.
These steps are illustrated in Figure 2
One major security flaw not considered is that people can register as many fake bio data as possible in the pre-voting registration stage or import people from neighboring states or country to register in Stage 1. This gives them eligibility for stage 2. Obviously, the TEMS is insufficient to provide the kind of procedure security an e-voting system need.
Design Method for E-Voting Visual Analytics System (EVAS)
The EVAS, which is built on the TEMS from continuous research is meant to be a major improvement taking into consideration more security and non security issues that are threatening to stem the progress of e-voting systems in today’s world and in the country in particular. Most of these issues have already been discussed in Section 1. Here, We describe the design of the EVAS.
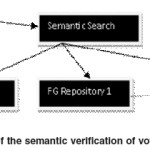
Overview of the Semantic Search
Bergenon (2008) emphasized the positive effect of using annotations of data to provide the opportunity for linking of sequence data between databases. He further went on to elaborate that semantic analysis is a key feature of the Natural Language Processing form of Machine Learning, and Work better in finding relations amongst data in different location than normal search can afford. This technique of semantic annotation and search has been applied in Knowledge management Uren et al (2005), and a lot of other crucial informationretrieval schemes with success (Gabrilovich & Markovich, 2009), etc. Dieter Fensel; the coordinator of the ontology group considered that visualizing the results of semantic annotation based searches would reveal new constructs that might erstwhile prove difficult to discover. For more information about semantic annotation search process or technique please visit Uren et al (2005).
In this subsection we show how the semantic annotation search technique is used in our overall e-voting process. The process is divided into two stages:
Stage 1: Pre-voting Registration
In this stage We use the concept of “Intelligent” Data Proposed by the Delphi Group (1994) that is; data that is aware of itself and its meaning. The intelligent data we intend to use here refers to creating xml datasets from an individual’s registration information that will contain annotations which will allow the semantic context link.
Below is a sample of intelligent data containing annotations that can be used in storing voters bio data.
<voter-e-voting-system-ontology: voting data
rdf: ID =”#Zone3 ward 19″/>
<active-e-voting-system-ontology: has-name
rdf:resource “#oluwafemi shawn ogunseye”/>
<active-e-voting-system-ontology: has-SSN
rdf:resource “#NGABK001”/>
<active-e-voting-system-ontology: has-sex
rdf:resource “#M”/>
<voter-e-voting-system-ontology : verification data
rdf: wsid:”http://www.nigeriassn.gov/private/12399/
”/>
<active-e-voting-system-ontology: has-name
rdf:resource “#folorunso olusegun”/>
<active-e-voting-system-ontology: has-SSN
rdf:resource “#NGABK023”/>
<active-e-voting-system-ontology: has-sex
rdf:resource “#M”/>
<voter-e-voting-system-ontology : verification data
rdf: wsid:”http://www.nigeriassn.gov/private/66399/
”/>
<active-e-voting-system-ontology: has-name
rdf:resource “Julius Okeosola”/>
<active-e-voting-system-ontology: has-SSN
rdf:resource “#NGLAG001”/>
<active-e-voting-system-ontology: has-sex
rdf:resource “#M”/>
<voter-e-voting-system-ontology : verification data
rdf: wsid:”http://www.nigeriassn.gov/private/12452/
”/>
The sample data above stores vital information about the voters and also stores the verification site address.
The annotations provide the information used in the search.
Stage 2: Voting
Voting will be done as normal with minor modifications.
Step 1: The potential voters assemble at various locations closest to them and enter their voting details {usually their names and a thumb print} in an e-voting system.
Step 2: The system crosschecks their data with the data collected in the pre-voting registration to see if it is consistent. The crosschecking is done using semantic search based on the annotations from the intelligent data which extends the reach of the authentication beyond mere pre-voting registration data or stage 1 data using the annotations to extract other vital information about the individual like address, social security number, Picture, Job (if applicable). If the individual had been able to deceive stage 1, he should not be able to do so in this step as the individual will obviously be missing one vital information or the other.
Step 3: If consistent the ballot is issued and the voter can vote Else the voter is denied access to ballot.
Step 4: The EVAS will bring up information (alert) of any defaulter and be able to record who is voting per ballot in addition necessary logging will be done for the central server. Faulty ballots can therefore be canceled before, during or even after the election.
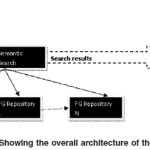
The EVAS Visualization process
After the data is searched for, it is sent to the Visualization tool Logic layer which preprocesses the data sorting them into usable tokens:
The Tree-map front end gets to hierarchical tree data exactly like the TEMS (Folorunso et al, 2008).
The other part of the intelligent data goes to another interface that enables analysis.
The Secondary database shown in figure 4 above stores the results of the semantic search so as to allow for a revisit whenever necessary.
Results
In this Section, the prototype implementation of the proposed model is shown.
The EVAS Prototype has two sections
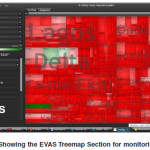
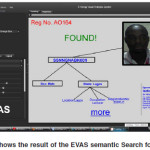
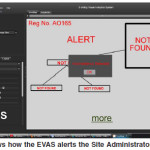
The tree map Section that is used to monitor the dataflow and result just like the TEMS that preceded it (Folorunso et al, 2010). The Inspector part helps highlight any abnormality detected using the semantically analyzed intelligent data to trace voter authenticity beyond the stage 1 level (Figure 7). In the case of a trace, the Inspector Section of the EVAS can always show the any candidates information (Figure 6)
Discussion
The Model Discussed in this paper is basically an improvement on an existing model. We looked at the issues with the previous model and addressed them through this EVAS model. The EVAS helps prevent procedural flaws of the e-voting process by increasing its intelligence and security exponentially and also provides the e-voting system with the much needed recounting facility.
The Recounting ability which has been a major issue in the usage of e-voting is achieved by show the any candidates information (Figure 6) EVAS because it can keep track of who actually voted through its semantic analysis of intelligent data collected during the stage 1 of the e-voting process and the secondary database server.
The model also covers all the specification of Wong and Thomas (2004).
Implementation Considerations
To be effective, the EVAS or any such implementation would be limited to either ‘on site’ or ‘zone wide’ servers, That implies that it should be used to monitor data with little or no proximity from the data source so that corrections, arrests or necessary actions can be immediately taken. The use of a custom made annotation tool for the application should be considered by the developer. Other possible challenges can be seen in Folorunso and Ogunseye (2008).
References
- Delphi Group, The document is the process, White Paper, Delphi Consulting Group Inc., http://www.delphigroup.com/research/ whitepapers/DocIsProcess.pdf (1994).
- James J. Thomas and Kristin A. Cook (Ed.), Illuminating the Path: The R&D Agenda for Visual Analytics. National Visualization andAnalytics Center. p.4 (2005).
- Michael Friendly, “Milestones in the history of thematic cartography, statistical graphics, and data visualization” [online] http:// www.math.yorku.ca/SCS/Gallery/milestone/ milestone.pdf [accessed August 2010] (2008)
- Jeffrey Heer and Maneesh Agrawala, Design considerations for collaborative visual analytics, Information Visualization 7, 49-62 (Spring 2008) | doi:10.1057/ palgrave.ivs.9500167 (2008)
- Pak Chung Wong and J. Thomas, “Visual Analytics”. in: IEEE Computer Graphics and Applications,24(5): 20–21 (2004).
- O. Folorunso O.S Ogunseye, J.O Okesola and O.M. Olaniyan, Visualizing E-Voting Results, Journal of Theoretical and Applied Information Technology (2010).
- Davide Balzarotti, Greg Banks, Marco Cova, Viktoria Felmetsger, Richard Kemmerer, William Robertson, Fredrik Valeur, and Giovanni Vigna, “Are Your Votes Really Counted?Testing the Security of Real-world Electronic Voting Systems”, ISSTA’08, ACM (2008).
- Victoria Uren, Philipp Cimiano , Jos´e Iria , Siegfried Handschuh, Maria Vargas-Vera a, Enrico Motta a, Fabio Ciravegna, Journal of web semantics, Elsevier (2005).
- Evgeniy Gabrilovich & Shaul Markovitch, Wikipedia-based Semantic Interpretation for Natural Language Processing, Journal of Arti¯cial Intelligence Research (2009)
- Folorunso O., and Ogunseye O.S., “Challenges in the adoption of Visualization: a survey”, Kybernetes, The International Journal of Cybernetics,37(9/10): 1530-1541(2008)
- Clinton H., “Hillary Clinton’s visit and e voting: the Heart of the matter” [online: retrieved August 18, 2009] http://www.vanguardngr.com/2009/08/18/hillary-clintons-visit-and – evoting-the-heart-of-the-matter/ (2009)
- Steve M, “E-democracy: stealing the Election in 2004”, Retrieved August 20, 2008 http://www.globalresearch.ca/articles/MOO407.html (2004)
- Habib Beary,“Gearing up for india’s electronic election” [online] Retrieved July 10, 2009 http://news.com.com/ (2004).
- Whitney Q., “Voting for Usability: Background on the issue”, [online] Retrieved August 20, 2008 http://www.wqusability.com/articles/ voting-background2000.html (2000).

This work is licensed under a Creative Commons Attribution 4.0 International License.