Introduction
Anderson, in 1980 [1], defined an intrusion attempt or a threat to be the potential possibility of a deliberate unauthorized attempt to access information, or manipulate information, or render a system unreliable or unusable. Since then, several techniques for detecting intrusions have been studied. Despite encrypting, attacks still occur and first layer of defense can still be penetrated. Intrusion Detection Systems (IDS) act as the “second line of defense” and they are placed inside a protected network, looking for known and potential threats in network traffic and/or audit data recorded by hosts1. In general, there are two approaches for detecting an intrusion in a computer systems and a computer network: misuse detection and anomaly detection. In misuse detection, an intrusion is detected when the behavior of a system matches with any of the intrusion signatures. Meanwhile the anomaly based IDS will detect an intrusion when the behavior of the system deviates from the normal behavior with certain significant tolerance.2 IDS can be treated
as pattern recognition problem or rather classified as learning system. Thus, an appropriate representation space for learning by selecting relevant attributes to the problem domain is an important issue for learning systems. According to Bello et al., 3 feature selection is useful to reduce dimensionality of training set; it also improves the speed of data manipulation and improves the classification rate by reducing the influence of noise. Thus selecting important features is an important issue in intrusion detection.4 This paper describes an initial work in finding optimal feature subset using Rough Set Theory.
Material and Methods
For this experiment, we have used the KDD CUP1999 data set. In this study, we used the subset that was preprocessed by the Columbia University and distributed as part of the UCI KDArchive (http://kdd.ics.uci.edu/databases/ kddcup99/kddcup99.html). The original data contained 744 MB data with 4,940,000 records. In our experiment, we only used 8000 records where 70% were used for training and another 30% were used for testing. This 70% comprised of 5600 records and the remaining 30% comprised of 2400 records. The dataset contained normal traffic and all categories of attacks.we are using the following steps in our experimental method :
Intrusion Data Set
In this experiment the KDD CUP 1999 data set [5,6] is used. This is the data set used for The Third International Knowledge Discovery and Data Mining Tools Competition, which was held in conjunction with KDD-99 The Fifth International Conference on Knowledge Discovery and Data Mining. The competition task was to build a network intrusion detector, a predictive model capable of distinguishing between “bad’’ connections, called intrusions or attacks, and “good” normal connections. This database contains a standard set of data to be audited, which includes a wide variety of intrusions simulated in a military network environment.
Using correlation
After getting idea from the literature , we start my experiment after collecting dataset from KDD CUP1999 using correlation between attributes of the dataset. Using correlation ,I get 10 different test datasets and 10 different train datasets in which each attribute value shows the correlation with other attributes.
The correlation between two attributes i.e.
A & B is 7:
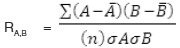
Where A bar, and B bar are mean of A, B respectively, n is the total no. of attributes, A and B the standard deviation of A and B respectively.
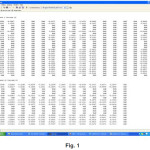
Now, using this formula we get the correlation values between attributes in Figure 1.
Using functional dependency
Next , we assume a threshold value i.e., θ= 0.4. Using this threshold value we do experiment on first training Dataset. Here, we get some functional dependency8, these are –
a1 → a22
a2 → a8 , a9
a6 → a16 , a25
a8 → a2 , a9 , a10
a9 → a2 , a8 , a10
a10 → a8 , a9
a15 → a19 , a20
a16 → a6 , a22 , a26
a17 → a26 , a27
a18 → a19 , a20
a19 → a15, a18, a20
a20 → a15, a18, a19
a21 → a16 , a22
a22 → a1, a21, a23
a23 → a22, a24
a24 → a23
a25 → a16, a26
a26 → a17, a25, a27
a27 → a17, a26
Closer property
After getting the functional Dependency , we are able to find out the closer property for each attribute. These are mentioned below8:
a1+ = { a1, a6, a16, a17, a21, a22 , a23, a24, a25, a26, a27 }
a2 + = { a2, a8, a9, a10 }
a6 + = { a1, a6, a16, a17, a21, a22 , a23, a24, a25, a26, a27 }
a8 + = { a2, a8, a9, a10 }
a9 + = { a2, a8, a9, a10 }
a10 + = { a2, a8, a9, a10 }
a15 + = { a15, a18, a19, a20 }
a16 + = { a1, a6, a16, a17, a21, a22 , a23, a24, a25, a26, a27 }
a17 + = { a1, a6, a16, a17, a21, a22 , a23, a24, a25, a26, a27 }
a18 + = { a15, a18, a19, a20 }
a19 + = { a15, a18, a19, a20 }
a20 + = { a15, a18, a19, a20 }
a21 + = { a1, a6, a16, a17, a21, a22 , a23, a24, a25, a26, a27 }
a22 + = { a1, a6, a16, a17, a21, a22 , a23, a24, a25, a26, a27 }
a23 + = { a1, a6, a16, a17, a21, a22 , a23, a24, a25, a26, a27 }
a24 + = { a1, a6, a16, a17, a21, a22 , a23, a24, a25, a26, a27 }
a25 + = { a1, a6, a16, a17, a21, a22 , a23, a24, a25, a26, a27 }
a26 + = { a1, a6, a16, a17, a21, a22 , a23, a24, a25, a26, a27 }
a27 + = { a1, a6, a16, a17, a21, a22 , a23, a24, a25, a26, a27 }
Reduct set
From the above closer set of attributes, we get 3 different reduct sets below [9]:
a) { a1, a6, a16, a17, a21, a22 , a23, a24, a25, a26, a27 }
b) { a2, a8, a9, a10 }
c) { a15, a18, a19, a20 }
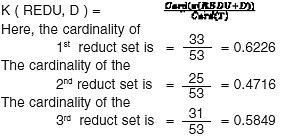
Cardinality
Next the cardinality of each reduct set was checked using the formula given below in which, the degree of dependency K ( REDU, D ) between the attributes REDU C and attributes D in decision table T ( C, D ) is10:
Results and Discussion
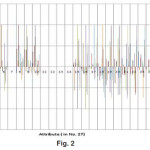
After doing the experimental work we found 10 correlation-matrix,one of which was mentioned in the above methodology. From the correlation-matrix of first training dataset i.e. Figure 1 we have got the following graph:
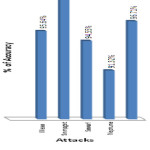
In the graph (Figure 2) ,the correlation between attributes is shown in 3-Dimention view.Here,series1 represents atrribute1(i.e. a1), series2 represents atrribute2(i.e. a2), series3 represents attribute 3(i.e. a3) and so on. After getting the correlation values between the 27 attributes of KDD CUP 1999 dataset, we get the 19 different Functional Dependency ‘s using the threshold value è = 0.4. And then using closer property I get 19 different values to predict the classification of these attributes. Thus, 3 different reduct-set of these attributes i.e. { a1, a6, a16, a17, a21, a22 , a23, a24, a25, a26, a27 }, { a2, a8, a9, a10 },{ a15, a18, a19, a20 }. Then using cardinality formula, the 3 different cardinality values of these reduct sets are generelated that are 0.6226, 0.4716, 0.5849. Among these values 0.6226 of reduct set { a1, a6, a16, a17, a21, a22 , a23, a24, a25, a26, a27} is the highest value. This means that the reduct set { a1, a6, a16, a17, a21, a22 , a23, a24, a25, a26, a27 } only can represent the characteristics of the total 27 attributes of the dataset. In the KDD CUP dataset there was three different attacks namely- Neptune attack ; Smurf attack; Snmpget attack . Our experimental methods in Support Vector Machine (SVM) 11 shows the result on different attacks which is represented in a Table 1.
In our experiment, we found the Normal value is – 96.71; Neptune attacks shows 91.32 ; Smurf attack gives – 94.55 and Snmpget attack gives the results of accuracy measurement of dataset- 100. And the mean value of these attacks is – 95.645. Here, we found the Snmpget attack shows much more accurate in compairison to Neptune and Smurf attacks . In other, hand the Neptune attack is showing the least accuracy than Smurf and Snmpget attacks.
References
- Debayo O. Adetunmbi , Samuel O. Falaki, Olumide S. Adewale and Boniface K Alese, “Network Intrusion Detection based on Rough Set and k-Nearest Neighbour”, International Journal of Computing and ICT Research, Vol. 2, No. 1, pp. 60 – 66.
- Andrew H. S. and Mukkamala S. ,2003, “Identifying important features for intrusion detection using support vector machines and neural networks”,IEEE Proceedings of the Symposium on Application and the Internet (SAINT ‘ 03).
- Biswanath M., Todd L.H., and Karl N.L. ,1994, “ Network Intrusion Detection. IEEE Network”, 8(3): page 26-41.
- Byunghae-cha K.P. and Jaittyun S.,2005, “Neural Networks Techniques for Host Anomaly Intrusion Detection using Fixed Pattern Transformation”,(ICCSA 2005), LNCS 3481 pp. 254-263.
- KDD CUP 1999 dataset : http:// kdd.ics.uci.edu/databases/kddcup99/Hettich S. and Bay S.D. ,1999, The UCI KDD Archive, Available at http://kdd.ics.uci.edu.
- Jiawei Han, Micheline Kamber, “ Data Mining: Concepts and Techniques”, Data Mining Books,Publisher: Elsevier Science Ltd. second edition, China Machine Press, pp. 296 -303.
- Abraham Silberschatz , Henry Korth , S. Sudarshan ,”Database System Concepts, Database Books”, McGraw-Hill .
- Xiaohua Hu, 2001 ,”Using Rough Sets Theory and Database Operations to Construct a Good Ensemble of Classifiers for Data Mining Applications” , Pages: 233 – 240 , ISBN:0- 7695- 1119-8.
- Ihn-Han Bae, Hwa-Ju Lee, and Kyung-Sook Lee , “Design and evaluation of a rough set-based anomaly detection scheme Considering weighted feature values” ; International Journal of Knowledge- Based and Intelligent Engg. System, Vol- 11, Number 4/ 2007, Page- 201-206.
- Chang, C., Lin, J., 2003, LIBSVM, “A Library for Support Vector Machines”. http:// www.csie.ntu.edu.tw/~cjlin/libsvm/.

This work is licensed under a Creative Commons Attribution 4.0 International License.