Development of Digital Spectral Library and Classification of Rice Crop Using Compressed ASTER L1 B Satellite Data
Shwetank¹, Kamal Jain² and Karamjit Bhatia³
¹Department of Computer Science & Engineering, Vidya College of Engineering, Meerut (India).
²Department of Civil Engineering,Indian Institute of Technology, Roorkee (IITR) (India).
³Department of Computer Science, Gurukul Kangri Vishwavidyalaya, Haridwar, (India).
Article Publishing History
Article Received on :
Article Accepted on :
Article Published :
Article Metrics
ABSTRACT:
In the present study Multispectral Image Processing (MIP) technique is applied on ASTER (Advance Spaceborne Thermal Emission and Reflection Radiometer) L1 B high resolution (15 m/ pixel) satellite data. A comprehensive spectral library of rice crop varieties : Hybrid-6129 (IET 18815), Pant Dhan-19 (IET 17544), Pusa Basmati-1 (IET-18990) and Pant Dhan-18 (IET-17920) has been developed with Blue (0.56 nm), Red (0.66 nm) and NIR (0.81 nm) spectral bands. The PCA (Principal Component Analysis) transformation with correlation matrix is applied for feature extraction to select an optimum subset of data in term of classification accuracy. Four PC (Principal Component) images selected for conventional spectral and integrated image classification. The integrated image Spectral/ NDVI (Normalized Difference Vegetation Index) is developed using Spectral and NDVI bands classified using ML (Maximum Likelihood) classifier. The conventional spectral classification accuracy for rice mapping is 79.5%, which improves up to 84.5% with Spectra/NDVI imagery data.
KEYWORDS:
Multispectral Image Processing (MIP); NDVI; PCA and ML (Maximum Likelihood)
Copy the following to cite this article:
Shwetank, Jain K, Bhatia K. Development of Digital Spectral Library and Classification of Rice Crop Using Compressed ASTER L1 B Satellite Data. Orient. J. Comp. Sci. and Technol;3(1)
|
Copy the following to cite this URL:
Shwetank, Jain K, Bhatia K. Development of Digital Spectral Library and Classification of Rice Crop Using Compressed ASTER L1 B Satellite Data. Orient. J. Comp. Sci. and Technol;3(1). Available from: http://www.computerscijournal.org/?p=2173
|
Introduction
Multispectral Image Processing (MIP) is a collection of techniques for the manipulation of high-density and multi-date, multi-stage, multi-polarized, multi-direction and multi-spectral satellite images by computers. MIP is an application of DIP (Digital Image Processing) having a great potential to identify specific plant species in vegetation covered area. It is widely used in crop protection, estimation of physiology and detection of biochemical components like nitrogen, pigment content,1-4 agricultural monitoring,5-6 mapping of cultivate area,7 growth and estimation of crops from local to global scale.8-9
For sustainable agriculture management there is no suitable infrastructure to monitor the rice crop and its varieties. The traditional method of compiling statistics on rice-crop acreage from different sources is time consuming and expensive. In addition, the information collected is often rough and unreliable for agricultural planners, managers or decision makers on regional and national scale.
The present research work focuses on analysis of conventional and integrated imagery data derived from ASTER L1B (Blue, Red and NIR) and NDVI data on pixel scale to extract the meaningful information in rice based agriculture system. The goal of this research is to develop a comprehensive digital spectral library and classify rice-crop varieties using a transformed integrated multispectral image in humid tropical agriculture system in the state of Uttarakhand in India.
Study Area and Data Used
The study area is surrounded with Ganga river (Water Body), Habitation (Lakshar Town), Forest and the boundary of the satellite data respectively. It lies between 29°45’32.723 N, 78°72 ”16.86’E and 29°44’54.47”N, 78°8’12.09”E. Uttaranchal is an agrarian state. About 80% of the population of the state is dependent on agriculture for its livelihood. 12% of the available land is irrigated and 64% are fed by natural springs.
In this research high-resolution (15-m) EOS-satellite Advanced Spaceborne Thermal Emission and Reflection Radiometer (ASTER) imagery (L1B) data has been used for image accuracy assessment of the training site. It is an advanced multispectral imager that was launched on board NASA’s Terra spacecraft in December, 1999. The ASTER instrument produces two types of Level-1 data: Level-1A (L1A) and Level-1B (L1B). ASTER L1A data are formally defined as reconstructed, unprocessed instrument data at full resolution. They consist of the image data, the radiometric coefficients, the geometric coefficients and other auxiliary data without applying the coefficients to the image data, thus maintaining original data values. The L1B data are generated by applying these coefficients for radiometric calibration and geometric resampling. Use of ASTER data for agriculture applications and management also requires atmospheric correction.10 ASTER L1 B data of 3rd September 2004 at 05:36 am is used, because the combination of wide spectral coverage with 14 spectral bands from the visible to the thermal infrared and high spatial resolution varies with wavelength: 15 m in the visible and near-infrared (VNIR), 30 m in the short wave infrared (SWIR), and 90 m in the thermal infrared (TIR) allows ASTER to discriminate amongst a large variety of surface materials, for geological studies, vegetation and ecosystem dynamics, hazard monitoring.
Methodology
Geometric Correction
The image is geometrically corrected to UTM projection with WGS-84 geographic datum in zone 44. Fig. 1 shows the subset of data (97 pixels x 82 pixels) used for integration of spectral and NDVI bands for Maximum Likelihood (ML) supervised classification.
Atmospheric Correction Using FLAASH
The atmospheric correction of satellite is a quantitative image processing technique to reduce the atmospheric influence in object reflectance value and atmospheric mixing. FLAASH (Fast Line-of-Sight Atmospheric Analysis of Spectral Hypercube) is an ENVI utility for handling particularly stressing atmospheric conditions, such as the presence of clouds.11 FLAASH tool is developed to improve the wavelength values of NIR (Near Infrared), VNIR (Visual and Near Infrared) and SWIR (Short Wave Infrared) bands in the electromagnetic spectrum. The input radiance image is converted in BIL (Band Interleaved by Line) or BIP (Band Interleaved by Pixel) format to get the celebrated radiance value in floating-point.
In the present study this tool is implemented on ASTER L1B data with Blue (0.56 nm), Red (0.66 nm) and NIR (0.81 nm) spectral bands. The centre water column value from FLAASH is found 4.11467 gm/cm2 and eliminated to improve the reflectance of the image.
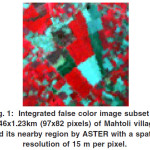 |
Figure 1: Integrated false color image subset of 1.46×1.23km (97×82 pixels) of Mahtoli village and its nearby region by ASTER with a spatial resolution of 15 m per pixel.
Click here to View figure
|
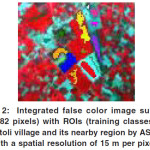 |
Figure 2: Integrated false color image subset (97×82 pixels) with ROIs (training classes) of Mahtoli village and its nearby region by ASTER with a spatial resolution of 15 m per pixel.
Click here to View figure
|
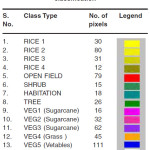 |
Table 1: Training classes and selected no. of pixels with color composition used in classification
Click here to View table
|
Digital Spectral Library
In Digital Image Processing (DIP) the reflectance value of an object can be represented in form of graph or curve and called spectral signature.12 The multiple portions of the subset known as ROIs (Regions of interest) with unique color composition are selected for digital library of spectral signatures and classification are listed in Table 1 and shown in Fig. 2. For intra-classes variability and unique discrimination of all objects a digital library of spectral signature is developed for RICE crop and its varieties are shown in Fig. 3. The four prime varieties Hybrid-6129 (IET 18815), Pant Dhan-19 (IET 17544), Pusa Basmati-1 (IET-18990) and Pant Dhan- 18 (IET-17920)13 are represented by thick Brown, Blue, Green and Black lines.
Integration of Spectral and NDVI Bands
Vegetation Indices (VI) are mathematical transformations signed to access the spectral contribution of vegetation to multispectral observations and have proved to be very useful in discriminating different land cover objects. The Normalized Difference Vegetation Index (NDVI) is one of the oldest, most well known, and most frequently used vegetation indices.14 The combination of its normalized difference formulation and use of the highest absorption and reflectance regions of chlorophyll make it robust over a wide range of conditions. It can, however, saturate in dense vegetation conditions when Leaf Area Index (LAI) becomes high. NDVI is defined by the following equation:
NDVI = (NIR-RED)/(NIR+RED)
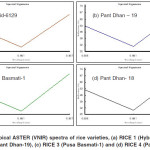 |
Figure 3: Typical ASTER (VNIR) spectra of rice varieties, (a) RICE 1 (Hybrid-6129), (b) RICE 2 (Pant Dhan-19), (c) RICE 3 (Pusa Basmati-1) and (d) RICE 4 (Pant Dhan-18).
Click here to View figure
|
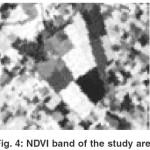
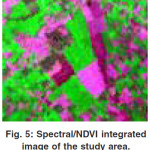
The value of this index ranges from -1 to 1. The common range for green vegetation is 0.2 to 0.8. The NDVI is calculated from the relative reflectance data of VNIR region. The ASTER data have two visual bands B1 (.56 nm), B2 (.66 nm) and one NIR B3 (.81 nm). The normalized difference vegetation index (NDVI) has been performed with NIR (B3) and RED (B2) bands as shown in Fig. 4. The integrated data is developed jointly by ASTER L1B data with Blue (0.56 nm), Red (0.66 nm), NIR (0.81 nm) and NDVI band shown in Fig. 5.
PCA (Principal Component Analysis)
Transformation
The PCA (Principal Component Analysis) transformation is a well established data compression tool that can be applied on multispectral data to reduce its dimensionality for feature extraction and classification. Dimensionality reduction refers to the process by which the main components attributing to the spectral variance of the data set are identified. This is also refers to removal of noise and data redundancy. The PCA transformation with covariance and correlation matrix may be applied to accomplish this task.15
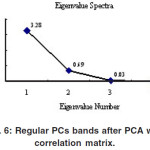
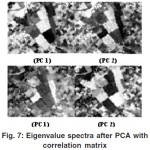
In the present study PCA transformation with correlation matrix is used to reduce dimensionality of Spectral/NDVI data. The new image layers are known PCs (Principal Components) and image pixels are represented by eigenvalues. The dimensionality of integrated data is determined by examining these values as shown in Fig. 6 and Fig. 7. The integrated data of four components, 82.5% of the data variance is explained by first principal component (PC1). Another 17.5% is covered in next three PCs.
Maximum Likelihood (ML) Classification
The Maximum Likelihood Classifier (MLC)15 is used to classify 14-landcover classes as listed in Table 1; in two phases, the first phase of classification is performed on Visible and Near-Infrared (VNIR) region only and second on Spectral/ NDVI image by ENVI 4.5 image processing software. To get the exact location of the training site and the location of the fields a hand-held GPS also used. According to the ground survey and discussion with local farmers, the land culture is not uniform in the study area. Therefore the RICE class has been divided into four different classes. The Google image of the study area has been used as a reference image to assist in identifying the land cover. A total 562 pixels have been chosen for training classes (samples) out of 7954 pixels. The classification accuracy is computed in the form of a confusion or error matrix by comparing a classification result with ground truth information. Each diagonal element of the confusion matrix is the percent of predicted classes that agree with the ground truth assignment of the pixel; whereas the off diagonals are those pixels that are misinterpreted as (or confused with) an alternative class.
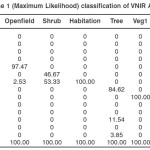
Spectral Classification
The overall classification accuracy based on different features in VNIR region is shown in Fig. 8 and summarized in Table 2. Table 2 shows the classification confusion matrix with 79.5% (447/562) overall accuracy and 0.77 kappa coefficient. There is observable confusion between the RICE1 and RICE4 class. The RICE1 class exhibits confusion with RICE4 (3.33%). RICE2 exhibits major confusion with the RICE4 (51.25%) class. RICE3 class shows signs of confusion with the RICE4 (35.48%) class. The analysis of the confusion matrix shows that RICE4 class do not have the case of confusion with any other class.
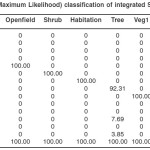
Spectral/NDVI Classification
The classification of Spectral/NDVI image and confusion matrix has been shown in Fig. 9 and Table 3. Table 3 shows the classification confusion matrix with 84.52 % (475/562) overall accuracy and 0.83 kappa coefficient. The RICE 1 and RICE 2 classes are classified 100% after Spectral/NDVI classification. There is no observable confusion between the RICE1 and RICE4 class after the integration. The classification accuracy of RICE 2 and RICE 3 classes is also improved from 41.50% to 80.00% and 64.52% to 76.42% respectively.
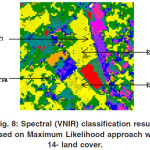 |
Figure 8: Spectral (VNIR) classification result based on Maximum Likelihood approach with 14- land cover.
Click here to View figure
|
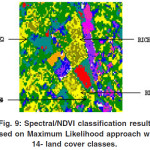 |
Figure 9: Spectral/NDVI classification result based on Maximum Likelihood approach with 14- land cover classes.
Click here to View figure
|
Result Analysis
Classification of integrated Spectral/NDVI image shows the RICE2, RICE3, TREE, VEG2, VEG3, VEG4 and VEG5 land cover classes are mixed in nature, except RICE1, RICE4, OPEN FIELD, SHRUB, HABITATION, VEG1 and MOISTURE classes. The spectral identities of RICE2 and RICE3 are heavily mixed together due the similarity of the crop species and their respective water content, which is verified after ground survey. On the other hand, other classes like TREE, VEG2, VEG3, VEG4 and VEG5 intermixing are acceptable, in context of their distribution characteristics. When NDVI (Normalized Difference Vegetation Index) band is integrated with conventional VNIR bands, it provides a significant improvement in the classification of RICE crop varieties. The result shows that the four types of rice crops have been classified more accurately using integrated Spectral/ NDVI image classification.
Summary and Conclusion
The aim of this study is to develop a new classification approach using integrated multispectral Spectral/NDVI image. The classification accuracy of integrated dataset is increased effectively than conventional spectral classification from 79.5% to 84.5%. The results show that the Maximum Likelihood Classifier (MLC) gives more accurate results than others classification algorithms to map the agriculture area using multispectral ASTER L1B data. The Spectral/ NDVI classification is beneficial to increase the accuracy of vegetation classes than conventional Spectral classification.
References
- L. D. Hinzman, M. E. Bauer, and C. S. T. Daughtry. “Effects of nitrogen fertilization on growth and reflectance characteristics of winter wheat”. Remote Sensing of Environment, 19(1): 47-61, 1996
- R. F. McMurtrey, E. W. Chappella, M. S. Kim J. J. Meisinger. 1994. “Distinguishing nitrogen fertilization levels in field corn (Zea mays L.) with active induced fluorescing and passive reflectance measurements”. Remote Sensing of Environment,47(1):36-44, 1994.
- K. Diker and W. C. Bausch. “Potential use of nitrogen reflectance index to estimate plant parameters and yield of maize”. Bio System Engineering, 85(4):437-447, 2003
- L. Chen, J. F. Huang, F. M. Wang and Y. L. Tang. “Comparison between back propagation neural network and regression models for estimation of pigment content in rice leaves and panicles using hyperspectral data”. International Journal of Remote Sensing,28(16): 3457-3478, 2007.
- D. Casanova, G. F. Epema and J. Goudriaan. J.“Monitoring rice reflectance at field level for estimating biomass and LAI”. International Journal of Remote Sensing,55(1-2):83-92,1998
- K. P. Gallo and T. K. Flesh. “Large-area crop monitoring with the NOAA AVHRR: estimating the silking stage of corn development”. Remote Sensing of Environment, 27, pp. 73–80, 1989
- H. Fang, H. Liu and H. Xuan “Using NOAA AVHRR and Landsat TM to estimate rice area year-by-year”. International Journal of Remote Sensing, 19, pp. 521–525. 1998
- B. C. Reed, J. F. Brown, D. Vanderzee, T. R. Loveland, J. W. Merchant and D. O. Ohlen. 1994, “Measuring phenological variability from satellite imagery”. Journal of Vegetation Science, 5, pp. 703–714, 1994.
- B. F. T. Rudorfe and G. T. Batista. “Wheat yield estimation at the farm level using TM Landsat and agrometeorological data. International Journal of Remote Sensing, 12, pp. 2477–2484, 1991
- Aleks Kalinowski and Simon Oliver. “ASTER Mineral Index Processing Manual”. Compiled by Remote Sensing Applications Geoscience Australia, (October 2004)
- A. L. Berk, , L. S. Bernstein, G. P. Anderson, P. K. Acharya, D. C. Robertson, J.H. Chetwynd and S. M. Adler-Golden. “MODTRAN Cloud and Multiple Scattering Upgrades with Application to AVIRIS”. Remote Sensing of the Environment, 65, pp.367-375, 1998.
- T. M. Lillesand and R. W. Kiefer. “Remote Sensing and Image Interpretation”, John Wiley & Sons, Inc. New Jersey, (1999)
- Division of Crop Science, Indian Council of Agricultural Research, New Delhi (2007)
- R. D. Jackson, P. N. Slater and P. J. Pinter. “Discrimination of Growth and Water Stress in Wheat by Various Vegetation Indices through Clear and Turbid Atmospheres”. Remote Sensing of the Environment. 15:187-208, 1993
- J. A. Richards. “Remote Sensing Digital Image Analysis: An Introduction”, Springer-Verlag, Berlin, Germany, p. 240, (1999)

This work is licensed under a Creative Commons Attribution 4.0 International License.