Vibha Agrawal¹ and Nilofar Iqbal²
¹Department of Chemistry, Gyan Ganga Institute of Technology and Management, Bhopal - 462 021 (India).
²Saifia College of Science & Education, Bhopal- 462 001 (India).
Article Publishing History
Article Received on :
Article Accepted on :
Article Published :
Article Metrics
ABSTRACT:
A number of studies have already been carried out for the physic-chemical analysis of paper mill effluents which are generally using wood and non-wood (bamboo, baggage etc.) as fibrous raw material for paper manufacturing process. This study deals with a paper mill which is using cotton comber and cotton linter as raw material for paper manufacturing. Effluents generated in the paper mill at different stages were sampled and analyzed. The degree of relationship between the variables under consideration is measured through the correlation analysis. The effect of correlation is to reduce the range of uncertainty. The prediction based on correlation analysis is likely to be more valuable and near to reality.
KEYWORDS:
SPSS Software; Correlation Matrix; Covariance; Variance; Frequency
Copy the following to cite this article:
Agrawal V, Iqbal N. Application of SPSS Software in Preparing Correlation Matrix. Orient. J. Comp. Sci. and Technol;2(2)
|
Copy the following to cite this URL:
Agrawal V, Iqbal N. Application of SPSS Software in Preparing Correlation Matrix. Orient. J. Comp. Sci. and Technol;2(2). Available from: http://www.computerscijournal.org/?p=2144
|
Introduction
The tremendous increase in industrial activity during the last few decades and the release of obnoxious industrial wastes into the environment, have been of considerable concern in recent years from the point of view of environmental pollution. Paper mills are generating large quantity of effluents as a consequence of pulping and bleaching processes.
During this pulping process a large quantity of black liquor is generated. The main component of which is the lignin, that is the cause for the coloration of water and higher biochemical oxygen demand and chemical oxygen demand of the effluents. Paper mills used bleaching chemicals generally chlorine based compound to improve brightness of paper.2 The effluent generated from the bleach plant, therefore having more adsorbable organic halide (AOX) and total organic chloride (TOCl).
The Degree of relationship between the variables under consideration is measured through the correlation analysis. Thus correlation is a statistical device which helps us in analyzing the co-variation of two or more variables. Both the correlated variables may be influenced by one or more other variables. Correlation is described or classified in several different ways. Three of the most important ways of classifying correlation are: positive or negative, simple, partial or multiple and linear or non-linear.
If both the variable are varying in the direction, i.e., if as one variable is increasing the other also increasing or if one variable is decreasing the other is also decreasing.
Chemical Treatment
Basic characteristics of raw material are that they have no free cellulose content. The cellulose remains linked with lignin. The lignin is to be separated from the cellulose by the process of pulping and bleaching. As the lignin is polymeric macromolecules, it requires drastic chemical treatment for the separation of cellulose fiber from the lignin. In spite of that some residual lignin remains inside the bleached pulp.1,7 Whereas the raw material cotton comber and linter has many unique characteristics having negligible lignin content. So, it requires very less chemical treatment for the pulping bleaching process for the removal of lignin in the conventional paper making process.
Generally in India most of the paper mills are adopting Kraft process for the pulping of raw material. In the Kraft process chemical called white liquor having composition. After pulping the pulp thus formed are bleached to remove the residual lignin and to make the pulp to the desired brightness.7 Different bleaching sequences are being adopted by different paper mills depending on the raw material and the end product. Generally chlorine, chloring dioxide, hydrogen peroxide and oxygen ar being used for the bleaching process. The pulping and bleaching process are the main process which causes the major component of the water effluent. The lignin causes the cellulose dark brown colour, whereas cellulose is a colourless component.
Experimental
Collection of sample
The effluent generated from various processes at the mill is segregated into two streams. Out of which the main effluent generated by the washing of fiber, refining and from machine backwater which is generally called white water. The other stream generated from the washing of digester house is called black and yellow liquor. Both the samples were collected separately and also tested separately. The fiber sample recovered after the treatment of white water and also the sludge generated from the black and yellow liquor plant also collected and tested separately. The effluent samples were collected in the incubated plastic bottles.
Analysis of Parameters
The heavy metal content of effluent apart from Na+ and K+ ions other heavy metals like iron, lead, mercury, copper, nickel, zinc were also detected and suitably estimated, using Atomic Absorption Spectrophotometer.
Calculation of Correlation
Out of several methods Karl Pearson’s coefficient or Pearson’s coefficient is used to calculate correlation. The Pearson coefficient of correlation is denoted by symbol r.
ρxy = Cov (x,y) / {√(var x)*√(var y)} Where, Cov (x,y) = ε(xy) – ε(x)* ε(y) var x = ε(x2) – {ε(x)}2
var y = ε(y2) – {ε(y)}2
ε(x) = Σ fx / Σf
here,
x = number of classes
f= frequency
ε = expected value Cov. = covariance Var. = variance
Correlation analysis helps us in determining the degree of relationship between two or more variables- it does not ell us anything about cause and effect relationship.
In this study samples are collected and results were analyzed and tabulated. After tabulation correlation matrix is prepared by calculating covariance. It shows rate of dependency. A value varies from -1 to +1. For independent attribute it is 0 (zero), for highly correlated it is -1 and for highly positively correlated it is +1. It is a statistical tool to show rate of dependency and with the help of computer application i.e. SPPS software it becomes too easy to calculate these results.
Result and Discussion
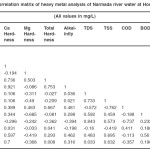
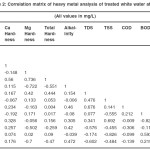
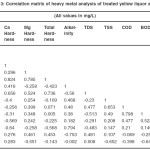
Result of Table- 1, 2, 3 and 4 shows that the heavy metals are present in the effluent samples. The results show lower heavy metal content in effluent sample than effluents of conventional paper mills. These results show that all are correlated to one another. Some of them shows negative correlation and some of them positive correlation.
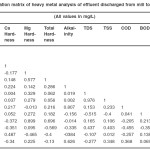 |
Table 4: Correlation matrix of heavy metal analysis of effluent discharged from mill to river narmada
Click here to View table
|
Conclusion
These are analyzed and they states that the data collection for the samples collected are correlated to one another. If one of the parameter changes up to some level, other parameter also changes as both are correlated to another as is also shown in the respective tables of correlation matrix.
Some of the parameters are related directly and some are inversely proportional to one another.
References
- Gupta, S. P., “Statistical methods”, educational publishers, New Delhi, 378-390 (2008).
- Smooke, G. A., “Handbook of pulp and paper technologies”, Joint textbook committee ofthe paper industry, p 167 (2207).
- Cartlon W., Dence and Douglas W. Reeve, “Pulp Bleaching-principles and practice” (1996).
- Shrivastava Brajesh K. and Massod Alam, Research on ground water quality for physico-chemical, heavy metals and bacteriological contamination, Current World Environment, 1 (2006).
- Shah Mayur C., The comparative study of water quality parameter of ground water among the 3 regions of Kalol Taluka Gujarat, Current World Environmental,1, (2006).
- http://forestr y. about . com/cs/treeid/f/ Tree_ID_wood.htm.
- http://en.wikipedia.org/wiki/Pollution.
- Dharm Dutt, J. S. Upadhyaya, R.S. Malik and C.H. Tyagi, Studies on pulp and paper-making characteristics of some Indian non-woody fibrous raw materials: Part-I, International Jour. of Cellu. Chem. and Tech. (Romania)’, 39(1-2): 115-128 (2005).
- Alfred Wong and Chen Chiu, “Pulping and Bleaching of Hemp,” 473 (2006).
- Hammer, Mark J., “Water and Wastewater Technology”, fourth edition (2003).
- Mall, I. D. and Upadhyay, S. N. Indian paper industry – Raw material problems and prospective. Chem. Eng. World, 24(2): 45-52 (1989).
- Mishra, P. C., Tripathy Smita and Pradhan Khageshwar : “Effects of paper mills waste water on growth and respiration of microhyla ornata tadpoles”.
- See http://www.cpcb.nic.in.
- Robert W. Hurter, “Agriculture residues”, TAPPI, non-wood fibers short course notes (1997).
- Hendriks, Elizabeth, “Water Soft-Path Application in Industrial Systems: A Pulpand Paper Case Study”, Canada theses (2007).
- Lizard, P. in Papermaking A Go-Go (S.T. Washer, Ed.), McGraw-Hill, New York, 467-534 (1907).

This work is licensed under a Creative Commons Attribution 4.0 International License.