Evaluating the Factors that Affect Service Quality Management on Arabic Public Sector
Introduction
The efficiency
of services is the cornerstone
of any public organization. Too many servers would increase the efficiency of
the service provided, but it increases the cost. The longer duration customers
spend waiting for service increases distress and anxiety, which will affect the customers’ evaluation of the service delivered 1.
Queuing is not only
a part of our daily lives,
but it is considered one of the major administrative tasks in an organization.
Queuing is the process where people, materials, or information need to wait for a certain time
to get a service 2.Service
quality is the global judgment or attitude relating to the overall excellence
or superiority of the service 3,4. Another
definition is, that
service quality is the discrepancy between the service quality that is
delivered by the organization and the service performance that employees
expected 5.
The concept of service has affected businesses all over the world; thus, it is of great importance. Service is defined as any act that one party offers to another that is intangible and does not result in ownership 6. Service quality began in the early 1920s as a method of product inspection to ensure that products are acceptable to customers. Quality is a survival tool for organizations that are undergoing a shift from a production-led to a customer-focused approach. The competitiveness of an organization is determined by the way it delivers services to the customers 8.
The
duration of the service has either positive or negative experiences for
customers. Short wait times give a positive impression of the services, either
high quality or
vice versa 9.
Providing services is more complex in the public sector; it is not simply
meeting the needs but finding the unexpressed needs and allocating resources.
The public sector organizations have come under pressure to improve efficiencies and deliver
quality service 10.
The service provided by the public sector is frequently a reflection of general
bureaucracy quality. As a result, governments need to continuously make improvements in the
public service quality to gain customer satisfaction 11. Service
quality and user satisfaction are important
evidence of user loyalty 12,13. Therefore, focusing on user
satisfaction will improve the quality assurance as well as on the quality of
the services 14.
Public sectors in Arabic countries
provide some of their services by traditional methods by attending
organizations physically. This method serves residents, which pushes them to
complain due to the waiting time queues. Therefore, this paper aimed to
identify and evaluate the factors affecting service quality management in the
public sector.
The
paper consists of five sections. After the introduction, the theory and
research propositions are developed. Next, the research methodology is presented, including
sample selection and research instruments. Data analysis and main research findings are
provided in the fourth section. Finally, research results are discussed.
Theory
and Research Propositions
Public sectors are becoming more
focused on service quality, intending
to satisfy the customers. To know whether the customer is satisfied with the service or
not, organizations need to measure the quality of the service.
Researchers measure the quality of service with the SERVQUAL model, which is
considered one of the most popular tools 15,16,17,18.
8studied the importance of the five factors of service quality, which are: tangible- physical facilities, equipment, and appearance of staff. Reliability is the ability to perform the promised service regularly and perfectly. Responsiveness is the willingness to help customers and provide quick service. Assurance is the knowledge and politeness of employees, and their ability to inspire trust and confidence. Empathy- the care and the individual attention the organization provides to its customers.
19used the survey as a tool to evaluate the services provided to customers by public transportation. The results of their study showed that the service quality meets the perception of the customers; this study recommended that service providers must understand the responsibility of providing reliable service to the customers. 20, in their study, aimed to measure customer perception towards services provided by public banks. Their questionnaire was used as a tool to collect the data, and the results of the study showed that banks create a good impression and satisfy their customers with the quality of service provided.
21used SERVQUAL framework in evaluating the relationship between quality of service and customer satisfaction. Their results showed that empathy, reliability, assurance, responsiveness, and tangibles have a significant relationship with customer satisfaction. While 23 measured the factors affecting customer satisfaction, through service quality provided by the courier company. 22 identified and ranked the critical factors affecting total quality management in South Africa; commitment of top management to quality gained the first rank.
Customers
from the public sectors in Arabic countries, providing services by the queuing system used in this paper as a
case study. The systems in these sectors providing services changed from time
to time to provide better service quality for their customers with a short waiting time.
However, the system changes are based on observations and recommendations by expert employees, taking
into account the customers’
complaints. The department of services uses customer flow technology, which tracks the
waiting times of customers. The department of services sets a target goal in the system for the
acceptable waiting times for the customers, which is usually less than five
minutes for each transaction. The data collected from the systems showed that
almost all the customers waited
more than 5 minutes. Therefore, the problem of this paper is evaluating the
factors that affect the
queuing quality of service from the perspective of customers in the Arabic
public sector.
The research method used in this case study is the quantitative method. A questionnaire was used as a tool to collect data. The variables of the questionnaire were divided into independent variables and dependent variables as follows:
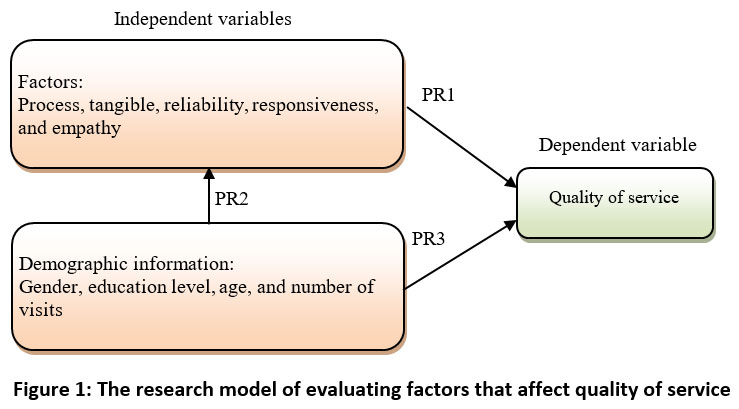
Independent variables are; The five factors of the questionnaire selected from the service quality factors model 7 and the 5Qs model 8,24. These factors are; process, tangible, reliability, responsiveness, and empathy with quality of service (QS) as a target goal, and the demographic information is; gender, education level, age, and the number of visits.
The dependent variable is quality of service.
Figure
1 shows the designed conceptual model, with the three propositions. These propositions are;
PR1: There are statistically significant effects of the factors (process, tangible, reliability, responsiveness, and empathy) on the quality of service.
PR 2: There are statistically significant
differences in the
demographic information (gender, education level, age, and the number of visits)
on the factors (process, tangible, responsiveness, reliability, and empathy).
PR3: There are statistically significant differences in the demographic information (gender, education level, age, and the number of visits) in the quality of service.
Research
Methodology
The
current study depends on a self-administered questionnaire.
The design of the questionnaire is based on knowledge gathered from surveying
several studies. The questionnaire consists of two parts. The first part was
for demographic information. The second part consists of 38 statements divided
into five factors and quality of service. The statements of the questionnaire
were rated by the 5-point Likert scale where; Strongly Disagree (SD)=1,
Disagree (D)=2, Neutral (NU)=3, Agree (A)=4, and Strongly Agree (SA)=5, which
is commonly used to measure attitude, providing a range of responses to a given
question or statement. Before
the questionnaire was distributed to the participants, it was validated by several academics. They
were asked to evaluate the contents of the questionnaire regarding the
language, accuracy, completeness, and clarity.
Five
intervals of the scale were used to interpret the respondents’ degree of
agreement. The following formula was used to calculate the score interval 25:
Score Interval = (Maximum Score–Minimum Score)/Number of levels
= (5-1) / 5 = 0.8 … (1)
The statement with
an average score of less than 1.8 was considered Strongly Disagree. The statement, which
falls between the averages of 1.81 to less than 2.6, was considered Disagree. The statement, which
falls between the averages of 2.6 to less than 3.4 was considered Neutral. The statement, which
falls between the averages of 3.4 to less than 4.2 was considered Agree. The statement, which
falls between the averages of 4.2 and 5 was considered Strongly Agree.
The
correlation between the factors calculated to measure the direction and the
degree of correlation rated between -1 and +1. The positive values mean
positive correlation, while the negative values mean negative correlation. The correlations less than
0.3 are considered weak, the correlations between 0.3 and 0.7 are considered
moderate, while the correlations more than 0.7 are considered strong.
Data
collected by the questionnaire survey method was analyzed in several steps using various
statistical methods. Validity analysis was conducted to ensure content validity, the items
adopted from previous studies, and the questionnaire piloted by interviews with 10
university professors and experts in the field of quality of service. They were
asked to evaluate the content regarding the language, accuracy, completeness, and clarity.
To measure the
internal consistency of the questionnaire, a reliability test was carried out
using Cronbach’s Alpha. The results showed that the Cronbach’s Alpha for all
statements is 0.89,
which is acceptable and indicates high internal consistency between the
statements of the questionnaire, since it’s higher than 0.6 26. The Empathy
factor gained the highest value with alpha of 0.80; the lowest value of
alpha is for the Tangible
factor, which
is 0.68. This means the reliability of this questionnaire data is acceptable.
Data
Analysis and Research Findings
Before
the statistical
analysis, the normal distribution test by Kolmogorov-Smirnov was applied. This test showed that the
statements in the
questionnaire have a
normal distribution, because the sig values for each statement in the
questionnaire are greater than 0.05. The results of Levene’s test for homogeneity
showed that the collected data from responses are homogenous because each statement has sig values
greater than 0.05.
The
number of customer participants in the questionnaire is 394. Table 1 shows the
descriptive profile of the sample. The majority of the respondents are male.
They are 355 out of 394 respondents, which is (90.1%) of the total respondents.
On the other hand, female respondents counted for 39 (9.9%) of the respondents’
total number. This is normal because the male is considered the head of the
family in Arabic countries. For education level, 204 (51.8%) of the respondents have a high school or lower level of education.
On the other hand, there were 190 (48.2%) of the respondents holding a
bachelor’s degree. The highest percentage of respondents falls into the age
group of (30 to less than 40) years old, representing 235 (59.6%) of the respondents, followed
by those who are between (20-30) years old and 74 (18.8%). However, the lowest
percentage was respondents who are 50 years and more with 6 (1.5%) of the
respondents. Many
respondents visited public sector organizations for transactions from 2-4 times, which represents 247
(62.7%) of the respondents, followed by 1 visit, which represents 95 (24.1%) of
the respondents. The lowest score was more than 4 times, which was 52 (13.2%)
of the respondents.
Table 1: The respondents’ demographic information.
|
Personal details
|
Gender
|
Education level
|
Age (years)
|
Number of visits
|
|
Variable
|
Male
|
Female
|
University
|
High school or lower
|
Less than 20 years
|
20 to less than 30
|
30 to less than 40
|
40 to less than 50
|
50 and more
|
1 time
|
2–4 times
|
More than 4 times
|
|
F
|
355
|
39
|
190
|
204
|
9
|
74
|
235
|
70
|
6
|
95
|
247
|
52
|
|
%
|
90.1
|
9.9
|
48.2
|
51.8
|
2.3
|
18.8
|
59.6
|
17.8
|
1.5
|
24.1
|
62.7
|
13.2
|
F: Frequency, %: Percentage
The
questionnaire contains 38 statements. For each statement, the frequencies, percentages, averages,
standard deviations (STD), and rates were calculated according to respondents,
where the rate
represents the degree of agreement.
Table
2 shows the results of the factors. For the 1st factor- process, the statement S1,
which states: “The waiting time for the receptionist to respond to my
request was acceptable”, got the highest average (3.77) with standard
deviation (0.691). The average of this factor is (3.39) with standard deviation
(0.503), which falls
in the neutral degree of agreement. It can be concluded that the customers are
not satisfied with the process provided, especially when it comes to the
waiting times for the service and its performance duration, and unsure about
the time they spend on
the system.
For
the 2nd factor-Tangible, the statement S7, which states: “The
waiting counter screen is visible and clear in the waiting hall”, got the
highest average (3.87) with standard deviation (0.797), which is an agreed degree of
agreement. The average of this factor is (3.40) with a standard deviation
(0.512), which is a neutral degree of agreement. However, it is very close to
the agreed degree
of agreement. The results show that customers were objective about the
infrastructure, or the tangible services provided. This is because most public
organizations don’t care much about the infrastructure or tangible services provided
to the customer.
For
the 3rd factor-Reliability,
the statement S13,
which states: “The employees have enough knowledge to answer my questions”, got an average of (3.76)
with standard deviation (0.773), which is an agreed degree of agreement. The average of
this factor is (3.38) with standard deviation (0.449), which is a
neutral degree of agreement. This means the customers who use the
organization’s website are objective
about the security, information updates, and the reliability and accuracy of
the website.
For
the 4th factor-Responsiveness,
the statement S22 “I am satisfied with the attention received
from the service counter”, got an average value of (3.85) with a standard
deviation (0.786), which is an agreed degree of agreement. The average of this factor is (3.45)
and the standard deviation (0.555), which is an agreed
degree of agreement. That is an indication that the customers are satisfied
with the attention of the department staff and their availability. On the other
hand, customers are not as happy with the speed of the employees in conducting
their transactions.
For
the 5th factor-Empathy,
the statement S28 “The organization provides online payments with
Credit/Debit cards”got an average value of (2.83) with standard deviation
(0.855), which is neutral degree of agreement.The results show that this factor
gains an average value of (2.42) and standard deviation (0.582), which is a
disagree degree of agreement. This indicates the organization needs to do publicity and
encourage their customers to use their online services.
For
the 6th factor-Empathy, the first rank goes to S38 “I am
satisfied with the services provided by the organization staff”, with an average value of
(4.04) with standard deviation (1.031), which
is an agreed degree
of agreement. The results show that this factor gains an
average (3.67)
with a standard deviation (0.650), which is an agreed degree of agreement. The results of this
factor indicate that the customers agree that the provided services are of
acceptable quality in general.
Table 2: Descriptive statistics of the factors.
|
No
|
Statements
|
Average
|
STD*
|
Rate
|
|
S1
|
The waiting time for the receptionist to respond to my request was acceptable
|
3.77
|
0.691
|
A
|
|
S2
|
The time I spent waiting in the queue (before getting to the service counter) was acceptable
|
3.52
|
0.766
|
A
|
|
S3
|
Time spent on performing my transaction was acceptable
|
3.51
|
0.805
|
A
|
|
S4
|
The waiting time from my arrival at the organization until I reached the service counter was acceptable
|
2.86
|
0.784
|
NU
|
|
S5
|
All types of transactions passed through the same process were acceptable
|
3.49
|
0.801
|
A
|
|
S6
|
The organization provides an express queue for short – period transactions
|
3.18
|
0.912
|
NU
|
|
Process factor – average
|
3.39
|
0.503
|
Neutral
|
|
S7
|
The waiting counter screen is visible and clear in the waiting hall
|
3.87
|
0.797
|
A
|
|
S8
|
There are enough employees at the reception desk
|
3.80
|
0.781
|
A
|
|
S9
|
There are enough number of service counters
|
3.45
|
0.837
|
A
|
|
S10
|
The department provided me with catalogues to access information
|
2.99
|
0.923
|
NU
|
|
S11
|
The website of the organization is easy to use and navigate
|
3.02
|
0.711
|
NU
|
|
S12
|
There are enough number of inquiry machines in the waiting area
|
3.25
|
0.911
|
NU
|
|
Tangible factor – average
|
3.40
|
0.512
|
Neutral
|
|
S13
|
The employees have enough knowledge to answer my questions
|
3.76
|
0.773
|
A
|
|
S14
|
The employees perform services correctly from the very first time
|
3.53
|
0.731
|
A
|
|
S15
|
The employees tell me exactly when my transaction will be done
|
3.39
|
0.870
|
NU
|
|
S16
|
Information provided by employees is clear and understandable
|
3.75
|
0.780
|
A
|
|
S17
|
Employees have the skills and knowledge to answer customers’ questions
|
3.65
|
0.832
|
A
|
|
S18
|
The organization’s website protects my personal information.
|
3.15
|
0.591
|
NU
|
|
S19
|
The information provided by the organization’s website is always updated
|
2.85
|
0.645
|
NU
|
|
S20
|
The information provided by the organization website is accurate and reliable
|
2.94
|
0.727
|
NU
|
|
Reliability factor – average
|
3.38
|
0.449
|
Neutral
|
|
S21
|
I am satisfied with the attention provided by the receptionist
|
3.84
|
0.758
|
A
|
|
S22
|
I am satisfied with the attention received from the service counter
|
3.85
|
0.786
|
A
|
|
S23
|
The administration staff are available to answer my question
|
3.76
|
0.854
|
A
|
|
S24
|
The employees are able to conduct transactions immediately or in a short waiting period
|
3.08
|
0.906
|
NU
|
|
S25
|
The organization’s website can process information and transactions quickly
|
2.72
|
0.637
|
NU
|
|
Responsiveness factor – average
|
3.45
|
0.555
|
Agree
|
|
S26
|
The organization’s web site has up-to-date technology
|
2.37
|
0.830
|
D
|
|
S27
|
The organization’s website enables to fulfill some types of transactions without the need to attend in person
|
2.01
|
0.879
|
D
|
|
S28
|
The organization’s provides online payments with Credit/Debit cards
|
2.83
|
0.855
|
NU
|
|
S29
|
The organization’s website can be used by smart-phones and tablets
|
2.30
|
0.861
|
D
|
|
S30
|
The organization’s website provides information about the documents needed to fulfill transactions
|
2.48
|
0.875
|
D
|
|
S31
|
The organization’s voice query service provides me with valuable information
|
2.51
|
0.926
|
D
|
|
S32
|
The organization’s website is linked with a government online payments service
|
2.46
|
0.832
|
D
|
|
Empathy factor – average
|
2.42
|
0.582
|
Disagree
|
|
S33
|
I’m satisfied with all types of services provided by the organization
|
3.78
|
0.986
|
A
|
|
S34
|
Overall, I am satisfied with the quality of service delivered by the organization
|
3.75
|
0.972
|
A
|
|
S35
|
I am satisfied with the overall waiting time for all services
|
3.56
|
0.975
|
A
|
|
S36
|
I am satisfied with the electronic services provided by the organization
|
3.38
|
0.834
|
NU
|
|
S37
|
For each visit to the organization, I never encountered a system out of service
|
3.50
|
1.007
|
A
|
|
S38
|
I am satisfied with the services provided by the organizational staff
|
4.04
|
1.031
|
A
|
|
Quality of service factor – average
|
3.67
|
0.650
|
Agree
|
*STD: Standard
deviation
All
the factors were analyzed for the whole of 394 responses, except for the factorempathy;only
the answers of 218 responds were
using the organization’s
website and electronic applications
were analyzed for this factor.
The
linear regression test was carried out for testing proposition PR1. Table 3
shows the results of testing this proposal. The table shows the process factor has a weak effect on quality
of service, with the
coefficient of determination r square equal 0.125, with Sig=0.000 and the regression equation
is QS = 1.975 + 0.494 (Process). The results assure that the process
is an important for improving the quality of service.
The
tangible factor has a weak effect on quality of service because
the coefficient of determination r square is 0.205, but it still has a significant effect because Sig=0.000. The
regression equation is QS = 1.760 + 0.560 (Tangible). The result assures that the tangible
factor has an effect on the provided services and can improve the quality of service.
For
the reliability factor,
the coefficient of determination r square is 0.313 and Sig= 0.000, which
indicates a moderate effect of the reliability factor
on quality of service. The regression equation is QS = 1.356 +
0.668 (reliability). The results indicate that the customers find that
reliability is an important factor in improving the quality of service.
For
the responsiveness
factor, the coefficient of determination r square is 0.290, which
indicates that there is a weak effect of the responsiveness factor on the quality of
service. It has
a significant effect because the Sig=0.000. The regression equation based on
the test is given as: QS = 1.487 + 0.621 (responsiveness). The
results indicate that responsiveness is an important attribute for
improving the quality of service.
For
empathy, the coefficient of determination r square value is 0.016, a
very weak and not significant because Sig= 0.065. The regression equation based
on the test is given as QS = 3.437 + 0.073 (empathy). However,
the respondents to this factor were only 218 of the total population. In addition, this factor
focuses more on the online services.
Table 3: Simple linear regression test for proposition PR1.
|
Factor
|
r
|
r square
|
F
|
Sig
|
|
Process
|
0.354
|
0.125
|
56.197
|
0.000
|
|
Tangible
|
0.453
|
0.205
|
101.235
|
0.000
|
|
Reliability
|
0.559
|
0.313
|
178.517
|
0.000
|
|
Responsiveness
|
0.538
|
0.290
|
158.746
|
0.000
|
|
Empathy
|
0.125
|
0.016
|
3.433
|
0.065
|
Proposition
PR2 was used to test the effect of demographic information on the process,
tangible, reliability, responsiveness, and empathy.
Table
4 shows the effect of gender on the factors of the questionnaire by using
independent samples T-test. The results show that gender has no statistically
significant effect on the factors “Process, Tangible, Reliability,
Responsiveness, and Empathy”.
Table 4: Independent samples T-test for gender effect on the questionnaire factors.
|
Factor
|
Gender
|
N
|
Average
|
STD
|
t
|
df
|
Sig.
|
|
Process
|
Male
|
355
|
3.444
|
0.511
|
-1.823
|
392
|
0.167
|
|
Female
|
39
|
3.598
|
0.399
|
-2.223
|
52.767
|
|
Tangible
|
Male
|
355
|
3.411
|
0.552
|
-2.632
|
392
|
0.800
|
|
Female
|
39
|
3.661
|
0.655
|
-2.296
|
44.142
|
|
Reliability
|
Male
|
355
|
3.454
|
0.577
|
-3.164
|
392
|
0.609
|
|
Male
|
39
|
3.764
|
0.609
|
-3.03
|
45.821
|
|
Responsiveness
|
Female
|
354
|
3.506
|
0.601
|
-2.675
|
389
|
0.535
|
|
Male
|
37
|
3.785
|
0.642
|
-2.535
|
42.859
|
|
Empathy
|
Female
|
201
|
2.386
|
0.665
|
-1.866
|
215
|
0.491
|
|
Male
|
16
|
2.714
|
0.821
|
-1.559
|
16.605
|
Table 5 shows the effect of education of the questionnaire’s factors by using the independent samples T-test. The results show that there are no statistically significant differences in the factors reliability and empathy according to education. On the other hand, there are significant differences in the factors: process, tangible, and responsiveness. According to the results, the averages of the holders of high school degrees or less were greater than the holders of university degrees. That explains why the university degree holders group has higher awareness than the high school or less, because they have more knowledge.
Table 5: Independent samples T-test for education effect on the questionnaire factors.
|
Factor
|
Education
|
N
|
Mean
|
STD
|
t
|
df
|
Sig.
|
|
Process
|
University
|
189
|
3.406
|
0.557
|
-2.093
|
391
|
0.001
|
|
High school or less
|
204
|
3.511
|
0.442
|
-2.075
|
358.525
|
|
Tangible
|
University
|
189
|
3.371
|
0.639
|
-2.225
|
391
|
0.000
|
|
High school or less
|
204
|
3.498
|
0.486
|
-2.203
|
350.034
|
|
Reliability
|
University
|
189
|
3.444
|
0.612
|
-1.375
|
391
|
0.089
|
|
High school or less
|
204
|
3.525
|
0.562
|
-1.371
|
381.065
|
|
Responsiveness
|
University
|
189
|
3.465
|
0.660
|
-2.167
|
388
|
0.007
|
|
High school or less
|
201
|
3.598
|
0.552
|
-2.155
|
367.142
|
|
Empathy
|
University
|
107
|
2.461
|
0.659
|
1.077
|
215
|
0.629
|
|
High school or less
|
110
|
2.361
|
0.702
|
1.078
|
214.711
|
Table 6 shows the result of variance
analysis in one way
ANOVA, according to
age. The table shows that the age has no statistically significant differences in the factors. This
indicates that there is no effect on the factors.
Table 6: One way ANOVA test for age effect on the questionnaire factors.
|
Factor
|
Source of variance
|
Sum of Squares
|
df
|
Mean Square
|
F
|
Sig.
|
|
Process
|
Between Groups
|
.818
|
4
|
0.205
|
0.808
|
0.521
|
|
Within Groups
|
98.477
|
389
|
0.253
|
|
|
|
Total
|
99.295
|
393
|
|
|
|
|
Tangible
|
Between Groups
|
2.279
|
4
|
0.570
|
1.784
|
0.131
|
|
Within Groups
|
124.242
|
389
|
0.319
|
|
|
|
Total
|
126.521
|
393
|
|
|
|
|
Reliability
|
Between Groups
|
1.3631
|
4
|
0.341
|
0.989
|
0.413
|
|
Within Groups
|
134.072
|
389
|
0.345
|
|
|
|
Total
|
135.435
|
393
|
|
|
|
|
Responsiveness
|
Between Groups
|
1.689
|
4
|
0.422
|
1.138
|
0.338
|
|
Within Groups
|
143.163
|
386
|
0.371
|
|
|
|
Total
|
144.852
|
390
|
|
|
|
|
Empathy
|
Between Groups
|
1.668
|
3
|
0.556
|
1.201
|
0.310
|
|
Within Groups
|
98.625
|
213
|
0.463
|
|
|
|
Total
|
100.294
|
216
|
|
|
|
Table 7 shows the result of variance
analysis by one-way ANOVA according to visited organization. The results show
there is no statistically significant difference in the process factor. On the other hand,
there are statistically significant differences in the tangible,
reliability, responsiveness, empathy, and quality of service. The
Scheffe test was used to explore the source of differences. The results showed
that there are statistically significant differences in the tangible,
reliability, and responsiveness factors between the 1 time visit
group and the more than 4 times visit group, in favor of the 1 time
visit group. The results indicate that the 1 time visit group perceives the
previous factors more than the other groups. There are statistically
significant differences in the responsiveness and the 2-4 times group
and the more than 4 times visit group, in favor of the 2-4 times group.
The results of the study reveal most
differences between the groups that visited more than 4 times. This indicates that
people who made visits more than 4 times, have become skeptical due to
the number of visits they made to the organization, with the addition of not
witnessing new developments in the services provided by the organization. In
addition, the group more than 4 times scored the lowest averages in
all the factors.
Table 7: One way ANOVA test for number of visits effect on the questionnaire factors.
|
Factor
|
Source of variance
|
Sum of Squares
|
df
|
Mean Square
|
F
|
Sig.
|
|
Process
|
Between Groups
|
0.558
|
2
|
0.279
|
1.085
|
0.339
|
|
Within Groups
|
97.768
|
380
|
0.257
|
|
|
|
Total
|
98.327
|
382
|
|
|
|
|
Tangible
|
Between Groups
|
2.879
|
2
|
1.439
|
4.487
|
0.012
|
|
Within Groups
|
121.909
|
380
|
0.321
|
|
|
|
Total
|
124.788
|
382
|
|
|
|
|
Reliability
|
Between Groups
|
3.881
|
2
|
1.941
|
5.625
|
0.004
|
|
Within Groups
|
131.100
|
380
|
0.345
|
|
|
|
Total
|
134.981
|
382
|
|
|
|
|
Responsiveness
|
Between Groups
|
4.284
|
2
|
2.142
|
5.869
|
0.003
|
|
Within Groups
|
137.602
|
377
|
0.365
|
|
|
|
Total
|
141.887
|
379
|
|
|
|
|
Empathy
|
Between Groups
|
3.370
|
2
|
1.685
|
3.676
|
0.027
|
|
Within Groups
|
93.500
|
204
|
0.458
|
|
|
|
Total
|
96.870
|
206
|
|
|
|
Proposition PR3 was used to test the effect of demographic information on quality of service.
Table 8 shows the effect of gender and
education level on quality of service by using independent samples
T-test. The results show that the gender and education level have statistically
significant effects on. The difference for females is greater
than for males
because females find many difficulties in visiting the organization of
public sectors. For education level, the customers holding secondary school or
less are greater than the holders of university
degrees. That explains that the university degree holders group has a higher awareness of service quality than
the high school or less, because they have more knowledge.
Table 8: Independent samples T-test for gender effect on the questionnaire factors.
|
Demographic parameter
|
Type
|
N
|
Average
|
STD
|
t
|
df
|
Sig.
|
|
Gender
|
Male
|
355
|
3.653
|
0.703
|
-2.571
|
392
|
0.043
|
|
Female
|
39
|
3.955
|
0.623
|
-2.835
|
49.294
|
|
Education level
|
University
|
189
|
3.516
|
0.734
|
-4.724
|
391
|
0.010
|
|
High school or less
|
204
|
3.841
|
0.631
|
-4.696
|
371.904
|
Table 9 shows the result of variance
analysis in one way
ANOVA according to age and number of visits. The table shows that the age has
no statistically significant differences in the service quality.
On the other hand, the number of visits has
statistically significant differences in the quality of service. The Scheffe test showed
there are statistically significant differences in the quality of service
between the 2-4 times group and the more than 4 times visit group, in favor of
the 2-4 times group. This indicates that the people who visited more
than 4 times, have become skeptical due to the number of visits they
made to the organization, with the addition of not witnessing new developments
in the services provided by the organization. In addition, the group
more than 4 times scored the lowest averages in the quality of service.
Table 9: One way ANOVA test for age and number of visits effect on the questionnaire factors.
|
Demographic parameter
|
Source of variance
|
Sum of Squares
|
df
|
Mean Square
|
F
|
Sig.
|
|
Age
|
Between Groups
|
2.240
|
4
|
0.560
|
1.142
|
0.336
|
|
Within Groups
|
190.756
|
389
|
0.490
|
|
|
|
Total
|
192.996
|
393
|
|
|
|
|
Number of visits
|
Between Groups
|
11.905
|
2
|
5.952
|
12.688
|
0.000
|
|
Within Groups
|
178.263
|
380
|
0.469
|
|
|
|
Total
|
190.167
|
382
|
|
|
|
Conclusion
The results of the study demonstrated
that the factors: process, tangible, reliability, and responsiveness
have an effect on quality
of service, while the empathy factor does not have an
effect on quality
of service.
An analysis was made of the
relationship between demographic information and the study factors. The results
showed statistically significant differences appeared for all factors except
for age. For the education groups, the results indicate that the university
group has more awareness quality
of service due to their knowledge. Among the groups for number of
visits, there were differences between them, according to the results. The more
than 4 times visit group perceived the quality of service less than the other groups
and that could be because of the times they had to visit to complete their
transactions, or as
they saw no improvements in service every time they visited the organization.
The study recommends improving the online
services, like enabling the customers to conduct all transactions without the
need to attend personally, and keeping the information updated on the website to reduce the
number of customers who come to the organization for enquiry only.
Conflict of Interest
There is no conflict of interest.
Funding Source
there is no funding source
References
- Al-Hamdan, H. (2009). The Impact of Waiting Time and Service Quality Delivery on Outpatient Satisfaction in Kuwaiti Public General Hospitals. MSc thesis, Maastricht School of Management, Netherlands.
- Nafees, A. (2007). Queuing Theory and its Application: Analysis of the Sales Checkout Operation in ICA Supermarket. MSc thesis, University of Dalarna, Sweden.
- Parasuraman, A., Zeithaml, V. & Berry, L. (1985). A Conceptual Model of Service Quality and its Implications for Future Research. The Journal of Marketing, 49, 41-50.
CrossRef - Parasuraman, A., Zeithaml, V. & Berry, L. (1988). Servqual. Journal of Retailing, 64(1), 12-40.
- Gronroos, C. (1988). Service Quality: The Six Criteria of Good Service Quality. Review of Business, 19, 10-13.
CrossRef - Kumasey, A. (2014). Service Quality and Customer Satisfaction: Empirical Evidence from the Ghanaian Public Service. European Journal of Business and Management, 6(6), 172-181.
- Agbor, J. (2011). The Relationship between Customer Satisfaction and Service Quality: a Study of Three Service Sectors in Umeå. MSc thesis, Umea School of Business, Sweden.
- Rahaman, M., Abdullah, M. & Rahman, A. (2011). Measuring Service Quality using SERVQUAL Model: A Study on PCBs (Private Commercial Banks) in Bangladesh. Business Management Dynamics, 1(1), 01-11.
- Mensah, A. (2010). Customer Satisfaction in the Banking Industry: A Comparative Study of Ghana and Spain. PhD thesis, University of Girona, Spain.
- Jnr, A. (2012). Service Quality and Customer Satisfaction in Public Sector Organizations: a Case Study of the Commission on Human Rights and Administrative Justice. Institute of Distance Learning, Kwame Nkrumah University of Science and Technology.
- Hadiyati, E. (2014). Service Quality and Performance of Public Sector: Study on Immigration Office in Indonesia. International Journal of Marketing Studies, 6(6), 104-117.
CrossRef - Bae, K. & Cha, S. (2015). Analysis of the Factors Affecting the Quality of Service in Public Libraries in Korea. 47, (3), 173-186, https://doi.org/10.1177/0961000614532483
CrossRef - Supriyanto, A., Wiyono B., & Burhanuddin, B. (2021). Effects of Service Quality and Customer Satisfaction on Loyalty of Bank Customers, Cogent Business & Management, 8 (1), DOI: 10.1080/23311975.2021.1937847
CrossRef - Pambreni, Y., Khatibi, A., Azam, S., & Tham, J. (2019). The Influence of Total Quality Management toward Organization Performance. Management Science Letters, 9(9), 1397-1406. DOI:10.5267/j.msl.2019.5.011
CrossRef - Hussain, S. & Rehman, S. (2012). Patient Satisfaction Regarding Hospital Services: A Study of Umea Hospital. MSc thesis, Umeå University, Sweden.
- Sabt, A. (2011). Measuring the Impact of using Technologies to Improve the Quality Performance of Service Organizations Case Study: Public Awqaf Foundation in the State of Kuwait. MSc thesis, Arabian Gulf University, Kingdom of Bahrain.
- Hassan, A. (2018). Factor Affecting Customer Satisfaction Towards Service Quality of Front Office Staff at the Hotel Putra Regency, Available at SSRN: https://ssrn.com/abstract=3187273 or http://dx.doi.org/10.2139/ssrn.3187273
CrossRef - Tuan, N., & Ly, N. (2020). Factors Affecting Customers’ Satisfaction on Service Quality – the Case of Duong Vy service Trading Limited Company. Science & Technology Development Journal – Economics – Law and Management, 4(3), 881-896.
CrossRef - Randheer, K. & AL-Motawa, A. (2011). Measuring Commuters’ Perception on Service Quality using SERVQUAL in Public Transportation. International Journal of Marketing Studies, 3(1), 21-34.
CrossRef - Shah, M. &Guha, S. (2013). A Study of Customer Satisfaction towards Service Provided by Employees of Public Banks using Servqual Model with Reference to Durg-Bhilai Region. International Journal of Management and Social Sciences Research, 2, 71-77.
- Zygiaris, S., Hameed, Z., Ayidh Alsubaie, M. & Ur Rehman S. (2022). Service Quality and Customer Satisfaction in the Post Pandemic World: A Study of Saudi Auto Care Industry. Front. Psychol. 13:842141. doi: 10.3389/fpsyg.2022.842141
CrossRef - Beraki, T., Beraki, M., Plecka, M., & Abdourrahmane, M. (2022). Factors Affecting the Implementation of Total Quality Management (TQM) in Small and Medium-Sized Enterprises (SMEs): The Case of South Africa. Journal of Organizational Culture Communications and Conflict, 26(3), 1-14.
- Yaacob, N. A. & Yaacob, T. Z. B. (2022). Factors Affecting the Level of Customer Service Satisfaction Towards the Courıer Service Management Quality at Johor Bahru, Scientific Journal of Innovation and Social Sciences Research, 2 (1), 27-44.
- Alsultanny, Y. & Alotibi, M. (2015). Evaluating the Factors Affecting on Intension to Use of E-Recruitment. American Journal of Information Science and Computer Engineering, 1 (5), 324-331.
- Alsultanny, Y. & Alzuhair, S. (2017). Evaluating Saudi Cement Companies Market Share, Emerald Journal of Science and Technology Policy Management, 8(2), 146-160, doi: 10.1108/JSTPM-11-2016-0031.
CrossRef - Marković, S. &Raspor, S. (2013). Exploring the Relationship between Service Quality and Customer Satisfaction in Croatian Hotel Industry. Tourism and Hospitality Management, 19(2), 149-164.
CrossRef

This work is licensed under a Creative Commons Attribution 4.0 International License.