Article Publishing History Article Received on : 19 Dec 2021 Article Accepted on : 22 Feb 2022 Article Published : 25 Feb 2022 Plagiarism Check: Yes Reviewed by: Dr. Lim Eng Aik Second Review by: Dr. Nasim Shah Final Approval by: Dr. Ajue Ramli
Article Metrics
ABSTRACT:
In the medical field computer-aided diagnosis systems (CADs) are an active area of research as CADs serve to aid medical professionals in simplifying the diagnosis of a patients condition. In this paper we propose a machine learning based method for classifying lumbar disc herniation. The automation of herniated disc diagnosis decreases the enormous weight on radiologists who need to analyse several cases every day manually. Automation will also help to decrease inter and intra rater variability. Hence his work focuses on the classification of lumber disc herniation based on sagittal view Magnetic Resonance Images (MRIs). The dataset used in this work comprises of 32 images from 32 patients of which 10 patients are healthy while 22 of them have herniated discs. This data is processed through various image processing techniques to obtain three sets of features: the binary image; shape, height and width measurements of discs; and full attribute images. The proposed approach consists of four stages: region extraction, image segmentation, feature extraction and classification. The classification process is performed through support vector machines (SVMs) and K-nearest neighbor (KNNs) of which the KNN with k=5 produced the best results with 78.6% accuracy, F1 score of 66.7%, precision and recall rate of 60% and 75% respectively.
Nicole T. X. H, Nisar H, Wei S. K. Classification of Lumber Spine Disc Herniation Using Machine Learning Methods. Orient.J. Comp. Sci. and Technol; 14(2,3,4).
Copy the following to cite this URL:
Nicole T. X. H, Nisar H, Wei S. K. Classification of Lumber Spine Disc Herniation Using Machine Learning Methods. Orient.J. Comp. Sci. and Technol; 14(2,3,4). Available from: https://bit.ly/3JQSGB8
Introduction
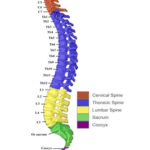
Lower back pain (LBP) may result from a herniated intervertebral disc by lifting too heavy objects or fracture of the vertebrae due to bruise or osteoporosis 1. The vertebral column, also known as the spinal column, spine, or backbone, is a bony structure that runs through the middle of the body 2. The human spinal column is made up of 33 bones, 7 cervical vertebras, 12 thoraxial vertebrae, 5 lumbar bones, 5 sacral and 4 coccygeal bone areas as shown in figure 1 3. The spinal cord itself, as well as surrounding tissues and bones, can be damaged by a spinal cord injury. This may result in herniated discs, which can develop anywhere along the spine, although the lower back is the most common location and different symptoms on the discs can be described as a bulging, protruding, or ruptured disc 4. Therefore, the main focus of this reserach is on the lumbar discs from (L1-S1).
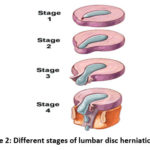
Lumbar disc herniation can be classified into different phases. Healthy discs may start to drain, shrink and loose their elastic property, resulting in a reduction in the total joint height. The four stages of herniation are classified as: disc protrusion, disc prolapse, disc extrusion and sequestered disc; these conditions have been illustrated in figure 2 5. The first two stages where the disc starts to protrude out of its original form are considered as an incomplete herniation, whereas the third and fourth stages where the disc is extruding further are considered as complete disc herniations 5.
Figure 2: Different stages of lumbar disc herniation [5]
Hence the main objectives of this work is to extract the region of interest (ROI) i.e. the individual discs from the MRI images, to determine the features of herniated and healthy discs for feature extraction. This will lead to the development of an automated system for the classification of healthy and herniated discs.
Literature Review
Many researchers have worked towards an automatic detection of lumber disc herniation especially over the past decade. Some of these researches will be discussed in this section. Alawneh et al. 6 proposed to perform ROI enhancement with the aid of noise removal tools and the contrast-limited adaptive histogram equalization (CLAHE) algorithm. This was followed by skeletonization to extract important features of the MRI images. Beulah et al.7 proposed to histogram of oriented gradients (HOGs) to extract features from the intervertebral disc (IVD) images before using the support vector machine (SVM) to train the images in order to obtain the classified output. Alomari et al. 8 proposed to perform disc localization before performing thresholding to obtain the initial boundary of the disc. This is followed by using a gradient vector flow active contour model (GVF-snake) to perform disc segmentation and finally, classification takes place by using a Gibbs-based classifier.
Ebrahimzadeh et al. 9 proposed to extract the spinal cords using Otsu’s thresholding and then aligning it with the third-order polynomial. This was followed by feature extraction and feature selection where the features of interest were the disc intensities and shape features. Finally, three classifiers: multilayer perceptron (MLP), KNN and SVM were used to classify the images. Ghosh et al. 10 proposed a robust and fully automated lumbar herniation diagnosis system using heterogeneous classifier. The intensity and texture features were extracted from the ROI for each disc. Five classifiers were constructed by using heterogeneous learning algorithms (SVM, PCA+LDA, PCA+NAÏVE, PCA+QDA and PCA+SVM) to detect if disc is herniated or not. Then combined majority voting scheme is adopted which results in a robust diagnostic system. The five cross-validation experiments are performed that achieve an accuracy of 94.85%, specificity of 95.9% and sensitivity of 92.45% for 35 clinical cases that is a total of 175 lumbar intervertebral discs. Salehi et al.11presented an automatic diagnosis of disc herniation in two-dimensional MR Sagittal images. For this purpose, 50 clinical MRI images include 250 lumbar area disc. The K-fold cross validation method is used by considering K=10. The average accuracy achieved is 97.91%. and 97.08% accuracy with K-fold cross validation method using KNN and linear SVM classifiers.
Rehman et al.12 proposed a robust framework of vertebra segmentation. This approach is capable of handling the complex shape variations in the vertebra efficiently. The U-Net architecture of deep convolutional network is used to extract the shape of bones and discs accurately. This method was implemented on two different datasets. In the first one 20 publicly available 3D spine MRI images were used for disc segmentation and in second case 173 CT scans were used for the thoracolumbar vertebrate segmentation. The accuracy for disc segmentation is 90.37% . Mbarki et al. 13 proposed a method for lumbar spine disc classification based on deep convolutional neural networks using axial view MRI. The accuracy achieved of the trained model was 94%. Shinde et al. 14 proposed a Multidomain Feature Level Fusion for Classification of Lumbar Intervertebral Disc using Spine MR Images. Two feature extraction techniques are exploited, one from spatial domain and other follows deep learning process. A popular Local Binary Pattern (LBP) texture descriptor extracts features from spatial domain is used. In addition, a pre-trained Convolution Neural Network (CNN), which acts as a feature extractor, extracts deep features. The training procedure using SVM classifier yields a model built from post-fusion feature vectors. The accuracy of around 92% is achieved.
Hence based on the literature review it is observed that different methods; from image processing to machine and deep learning have been used for segmentation and classification of lumbar disc herniation. However all these methods are applied on different datasets, hence it is difficult to evaluate the true significance of the work done. Hence in this preliminary work, we plan to use image processing and machine learning methods to classify lumbar disc herniation, and later in future we will extend our analysis to several datasets to evaluate the effectiveness of the methods developed.
Material and methods
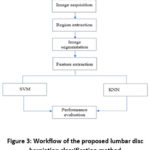
In this paper, an automated system has been developed to classify healthy and herniated discs from magnetic resonance imaging (MRI) scans. The MRI scans used here are of the sagittal (side) view. A set of algorithms are used to enhance the images for accurate extraction of regions of interest (ROI). The precision of these ROIs are vital for feature extraction and classification of the discs using machine learning classifiers. This method can be divided into four main phases: 1 region extraction, 2 image segmentation, 3 feature extraction and 4 classification. The workflow is illustrated in figure 3.
Figure 3: Workflow of the proposed lumbar disc herniation classification method
The dataset contains MRI scans of 32 patient’s, where
10 patients have all healthy lumbar discs while 22 patients contain herniated
lumbar discs as well as healthy lumbar discs. Hence out of 160 (32×5) lumbar
discs, there are 112 healthy lumbar discs and 48 herniated lumbar discs. It
should also be noted that the herniated lumbar discs may be in any of the
multiple stages of lumbar disc herniation.
The CAD system is developed using the
Python programming language as there are many diverse libraries to be used
which makes the results to be replicated easily. The Python libraries used are
OpenCV for the image processing and Sklearn for the classification. The
designed system can be divided into four general steps: ROI extraction, ROI
enhancement, feature extraction and classification.
The 5-fold cross validation scheme has been
implemented and the data has been divided into the training, validation and
testing sets. It should be noted that the test sets are set aside from the
training and validation sets. This whole project is done on a NVDIA GeForce GTX
equipped Acer Nitro 5 with 16GB memory. The image processing stages were
implemented in MATLAB, while the training was performed on a Spyder IDE using
the Scikit-learn Python library.
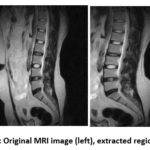
In the region extraction phase, the main region of the image is extracted from the MRI images. As the original MRI scans include neighbouring parts of the human body which are not required, hence only the lumbar discs located in the middle of the image are extracted manually, as shown in figure 4, while the other regions are cropped off and discarded. This step aids in the extraction process by narrowing down the scope of the image that is to be processed.
Figure 4: Original MRI image (left), extracted region (right)
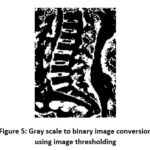
Subsequently, the cropped RGB images are converted to grayscale images. Adaptive thresholding is then applied by specifying the threshold value to convert the grayscale images to binary images. The threshold value is not fixed but determined by trial and error, and in this case the optimum threshold value was found to be 0.9. The output of this stage is shown in figure 5.
Figure 5: Gray scale to binary image conversion using image thresholding
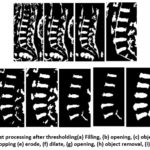
In the image segmentation phase, several image processing techniques have been implemented to enhance the images to allow important features to be extracted. As it can be observed from figure 5, there are still many irrelevant details in the image which should be removed before segmenting individual discs, and there are holes in several discs which need to be filled. The series of image processing techniques used in the post processing have been summarised in figure 6. The figure 6(a) depicts the filled segmented binary image. This is followed by opening to remove objects with sizes smaller than 50 pixels as shown in figure 6(b). Subsequently, a built in MATLAB function was applied to remove objects which touch the image border and the outcome is as shown in figure 6(c). The image is then cropped to narrow down the focal area as depicted in 6(d) before the image is eroded with a structuring element of radius size 1 as shown in figure 6(e). The image is then dilated with the same disc-shaped structuring element. Then, opening was performed using a disc-shaped structuring element of a radius size 2 as shown in 6(g). The objects touching the border were then removed before being dilated using the same structuring element as in 6(g).
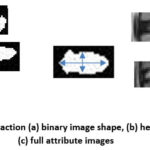
After post processing the image is ready for feature extraction. Three features are extracted from the binary images obtained: the binary disc shape as shown in figure 7(a), the height and width features as shown in figure 7(b) and the full attribute images as shown in figure 7(c). The binary disc shape images were obtained from the image segmentation phase and manually cropped into their individual discs. The height and width features of each individual binary disc from the segmented images were determined from the built-in MATLAB function ‘regionprops’, whereas the full attribute images were the original MRI images which have been manually cropped into their individual discs withour prior pre-processing.
In the classification phase, the diagnostic process is performed on selected features – namely the segmented binary disc shape, the height and width feature, and the full attribute images. Several classifiers are applied to identify the best relation between the features and produce the best accuracy possible. The classifiers used are the support vector machine (SVM) and K-nearest neighbour (KNN) 15-16
SVM is considered as a
linear classifier which is used for classification and regression. SVM
algorithm finds the decision boundary or hyper plane that separates the data
into different classes. SVM has less
over-fitting problem as compared to other algorithms and works well with high
dimensional data. The shortcoming of SVM includes large amount of time is needed
to train the model if the dataset is big. Besides, it is difficult to choose a
proper kernel function used in SVM.
K-Nearest Neighbor
classifier is the most fundamental type of classifier. It classifies the target
data by using the majority class of nearest neighbors. By determining the
correct number for k, the optimal classification result can be achieved. It
implements a non-parametric technique where there is no assumption made for the
data distribution in KNN algorithm. Besides, the training time is short as KNN
stores all the training data. A new object can be classified according to the
concept of its k nearest neighbours. An odd number is preferable for the value
k as to prevent a situation in which the numbers of objects from both classes
are the same. One of the benefits of implementing KNN algorithm is that
this algorithm is relatively simple and easy to understand and interpret. The SVM and KNN classifiers have shown promising
results for many biomedical applications [17-21].
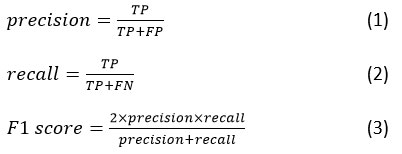
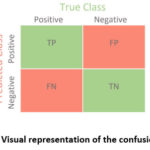
The performance of the models implemented in this paper have been evaluated based on the accuracy, F1 score, precision and recall. These evaluation metrics are calculated based on the confusion matrix which comprises of the true positives (TP), false positives (FP), true negatives (TN) and false negatives (FN) as shown in figure 8. The precision- also known as the positive predictive value, and recall also known as the sensitivity, are both measured based on relevance. These two measurements contribute to the calculation of the F1 score. The formulas involved in the calculations of these parameters are given as follows:
Figure 8: Visual representation of the confusion matrix
The main aim of this paper is to classifiy herniated and healthy discs. The
dataset used in this project comprises of 32 sagittal lumbar MRI scans from 32
patients where 10 of the patients are healthy while 22 of them have herniated
discs. The size of each image is 200×200 pixels and in each sample, five of the
discs (L1-L2), (L2-L3), (L3-L4), (L4-L5) and (L5-S1), are examined. However out
of 160 discs, only 138 discs were successfully extracted by the segmentation
process. Out of these 138 dics images, 41 images are of herniated discs while
the remaining 97 images are of healthy discs.
Two types of classifiers were implemented in this paper to study the classification performance: support vector machine (SVM), K-nearest neighbour with K=3, 5 and 9. The performance of these models was evaluated based on accuracy, F1 score, precision and recall rate as shown in tables 1 to 6. These evaluations were based on TP, TN, FP and FN. These classifiers were applied to all the three sets of data: segmented binary images, and height and weight features; full attribute images. The segmented binary images have been selected as one of the features as the segmentation serves to enhance the shape and of the degenerated discs as well as to capture the annular fibrosis leak from the discs. The height and width has been selected as one of the features to be extracted due to the fact that herniated discs tend to have a wider width and shorter height due to the leaking. The full attribute images have also been selected as one of the features for comparison. Performance is evaluated both for balanced as well as unbalanced data.
Table 1: Performance evaluation based on binary image (balanced data)
Accuracy
F1 Score
Precision
Recall
TP
FP
FN
TN
SVM
0.824
0.842
0.727
1.000
6
0
3
8
KNN3
0.765
0.778
0.700
0.875
6
1
3
7
KNN5
0.765
0.778
0.700
0.875
6
1
3
7
KNN9
0.882
0.889
0.800
1.000
7
0
2
8
Table 2: Performance evaluation based on height and width features (balanced data)
Accuracy
F1 Score
Precision
Recall
TP
FP
FN
TN
SVM
0.647
0.727
1.000
0.571
8
0
3
6
KNN3
0.706
0.706
0.667
0.750
6
2
3
6
KNN5
0.588
0.632
0.545
0.750
4
2
5
6
KNN9
0.588
0.588
0.556
0.625
5
3
4
5
Table 3: Performance evaluation based on full attributes (balanced data)
Accuracy
F1 Score
Precision
Recall
TP
FP
FN
TN
SVM
0.706
0.706
0.667
0.750
6
2
3
6
KNN3
0.824
0.842
0.727
1.000
6
0
3
8
KNN5
0.706
0.706
0.667
0.750
6
2
3
6
KNN9
0.647
0.625
0.625
0.625
6
3
3
5
Table 4: Performance evaluation based on binary images (unequal data)
Accuracy
F1 Score
Precision
Recall
TP
FP
FN
TN
SVM
0.75
0.533
0.571
0.5
17
3
4
4
KNN3
0.643
0.286
0.333
0.25
16
4
6
2
KNN5
0.643
0.286
0.333
0.25
16
4
6
2
KNN9
0.679
0.182
0.333
0.125
18
2
7
1
Table 5: Performance evaluation based on height and width features (unequal data)
Accuracy
F1 Score
Precision
Recall
TP
FP
FN
TN
SVM
0.71
0.69
0.71
0.71
16
6
2
4
KNN3
0.679
0.471
0.571
0.4
15
3
6
4
KNN5
0.643
0.444
0.5
0.4
14
4
6
4
KNN9
0.786
0.667
0.750
0.6
16
2
4
6
Table 6: Performance evaluation based on full attribute images (unequal data)
Accuracy
F1 Score
Precision
Recall
TP
FP
FN
TN
SVM
0.679
0.308
0.4
0.250
17
3
6
2
KNN3
0.750
0.462
0.6
0.375
18
2
5
3
KNN5
0.786
0.5
0.750
0.375
19
1
5
3
KNN9
0.714
0.429
0.5
0.375
17
3
5
3
Based on the results obtained from the balanced data, it can be observed from table 1 for binary data that the performance of the KNN9 classifier for the binary images produces the best results with an overall accuracy of 88.2%, an F1 score of 88.9%, a precision rate of 80% as well as a recall rate of 100%. Hence, it can be said to outperform all other classifiers. It is to be noted that the performance of the KNN classifiers improve as the K values increase, however there is a limit to this as the performance of accuracy of KNN11 drops by approximately 6% compared to KNN9, so it is not presented in the current work.
Based on the results in table 2 for height and width features, it can be observed that the KNN3 classifier performs best when implemented on the extracted height and width features of each disc. The KNN3 classifier has a performance of a 70.6% rate of accuracy and F1 score, a precision rate of 66.7% and a recall rate of 75%. The performance of the KNN classifiers have dropped once the values of K increase above K=3. Hence, the runner up in terms of general performance is the SVM at 64.7% rate of accuracy. However, it is to be noted that the SVM performs best in terms of precision rate as opposed to the KNN3. The results obtained in table 2 are not as good as in table 1. This may be due to the fact that despite herniated discs tend to have a reduced height and elongated width it may be possible that what may be classified as a normal disc height and width for one patient, may be considered a herniated disc for another. Hence this may contribute to the inaccurate predictions by the classifier.
As shown from the results in table 3 for full attribute images, it can be observed that the KNN3 model produces the best results with an accuracy of 82.4%, an F1 score of 84.2%, precision of 72.7% and a 100% recall rate. It can also be observed that both the SVM and KNN5 models have equal performances in all aspects. However, when compared to table 1, the results of the full attribute images are inferior. This may be due to the fact that the full attribute images have not undergone any pre-processing to enhance the images and therefore the noise and blurred edges of the images may have affected the performance of the classifiers.
Therefore, based on the results of all three sets of data, it can be said that the classifiers perform best when implemented on the segmented binary images in table 1, of which the KNN9 classifier produces the best results. As mentioned earlier, an increase in K values would result in an increase in the rate of performance evaluation, however this reduces the distinction between classes as the samples are obtained from neighbours located further away. It is also to be noted that K is typically chosen as an odd number to avoid having a tie between classes 22.
The unbalanced data was then used to compare the results with that of the balanced data as it represents data that is closer to real-world situations as in tables 4 to 6. It can be observed that after using all 138 images without balancing the data, the results across all three data types have dropped compared to that of the balanced data. The best overall performance was found to be from the height and width features using the unbalanced dataset with the KNN9 as the best performing model with 78.6% accuracy, 66.7% F1 score, precision rate of 75.0% and recall rate of 60.0 %. The best performing models from the binary image set and the full attribute image set are the SVM and KNN5 respectively.
Conclusion
In this paper a method has been proposed for the classification of lumbar disc herniation. Through the analysis of the results obtained, it can be observed that better results can be obtained when the dataset is balanced, however this is not likely to happen in real-world situations and therefore the unbalanced dataset depicts results that are more realistic for the methods applied in this paper. This results in a drop in performance across all three types of features: binary images, height and width features and full attribute images, with the best performing data being that of the extracted height and width features, however the difference in performances of all three types of data are not too far off from each other as compared to the balanced dataset. Hence, it may be suggested that the unbalanced dataset could potentially produce better results for all three attributes in general. For classification KNN performs better than SVM. Further improvements in future may take the form of automatically segmenting the images, implementing deep learning methods to obtain better classification rates, and subsequently attempt to classify the discs according to their level of injury.
Acknowledgement
None
Conflict of Interest
There is no conflict of interest.
Funding Source
There is no funding sources.
References
Cleveland Clinic. 2020. Spine Structure & Function: Parts & Segments, Spine Problems, Spine Health. [online] Available at: https://my.clevelandclinic.org/health/articles/10040-spine-structure-and-function>[Accessed 5 August 2021].
Aghayev, K., 2019. Lumbar Disc Herniation. [online] Available at: <https://www.kamranaghayev.com/page/lumbar-disc-herniation> [Accessed 5 August 2021].
Disabled World. 2021. Human Spine and Spinal Cord Picture C1 – S5 Vertebra. [online] Available at: <https://www.disabled-world.com/disability/types/spinal/spine-picture.php> [Accessed 5 August 2021].
Mayo Clinic. 2019. Herniated disk – Symptoms and causes. Available at: <https://www.mayoclinic.org/diseases-conditions/herniated-disk/symptoms-causes/syc-20354095#dialogId19826089> [Accessed 5 August 2021].
Dawson, E., n.d. Herniated Discs: Definition, Progression, and Diagnosis. [online] Available at: <https://www.spineuniverse.com/ conditions/herniated-disc/herniated-discs-definition-progression-diagnosis> [Accessed 5 August 2021]
Alawneh, K., Al-dwiekat, M., Alsmirat, M. and Al-Ayyoub, M. 2015. In: . 6th International Conference on Information and Communication Systems (ICICS). Jordan, 7-9 April 2015. IEEE.
Beulah, A. and Sharmila, T. 2016. Classification of Intervertebral Disc on Lumbar MR Images using SVM. In: 2nd International Conference on Applied and Theoretical Computing and Communication Technology (iCATccT). India, 21-23 July 2016. IEEE. CrossRef
Alomari, R., Corso, J., Chaudhary, V. and Dhillon, G. 2010. Toward a clinical lumbar CAD: herniation diagnosis. International Journal of Computer Assisted Radiology and Surgery, 6, pp 119-126. CrossRef
Ebrahimzadeh, E., Fayaz, F., Ahmadi, F. and Nikravan, M. 2018. A machine learning-based method in order to diagnose lumbar disc herniation disease by MR image processing. Biomedical Engineering: Applications Basis and Communications, 30(6), pp CrossRef
Ghosh, S., Raja’S, A., Chaudhary, V., & Dhillon, G. (2011, March). Computer-aided diagnosis for lumbar mri using heterogeneous classifiers. In 2011 IEEE International Symposium on Biomedical Imaging: From Nano to Macro (pp. 1179-1182). IEEE. CrossRef
Salehi, E., Yousefi, H., Rashidi, H., & Ghanaatti, H. (2019, April). Automatic Diagnosis of Disc Herniation in Two-Dimensional MR Images with Combination of Distinct Features Using Machine Learning Methods. In 2019 Scientific Meeting on Electrical-Electronics & Biomedical Engineering and Computer Science (EBBT) (pp. 1-6). IEEE. CrossRef
Rehman, F., Shah, S. I. A., Riaz, N., & Gilani, S. O. (2019). A Robust Scheme of Vertebrae Segmentation for Medical Diagnosis. IEEE Access, 7, 120387-120398. CrossRef
Mbarki W, Bouchouicha M, Frizzi S, Tshibasu F, Farhat LB, Sayadi M. Lumbar spine discs classification based on deep convolutional neural networks using axial view MRI. Interdisciplinary Neurosurgery. 2020 Dec 1;22:100837. CrossRef
Shinde JV, Joshi YV, Manthalkar RR. Multidomain Feature Level Fusion for Classification of Lumbar Intervertebral Disc Using Spine MR Images. IETE Journal of Research. 2020 Jul 24:1-4 CrossRef
Bzdok, D., Krzywinski, M. and Altman, N., 2018. Machine Learning: Supervised methods, SVM and kNN. Nature Publishing Group, pp. 1-6. CrossRef
Palaniappan, R., Sundaraj, K. and Sundaraj, S., 2014. A comparative study of the svm and k-nn machine learning algorithms for the diagnosis of respiratory pathologies using pulmonary acoustic signals. BMC Bioinformatics, 15 (223). CrossRef
Nisar, H., Ch’ng, Y.K. and Ho, Y.K., 2020, November. Automatic Segmentation and Classification Of Eczema Skin Lesions Using Supervised Learning. In 2020 IEEE Conference on Open Systems (ICOS) (pp. 25-30). IEEE. CrossRef
Nawaz, R., Cheah, K.H., Nisar, H. and Yap, V.V., 2020. Comparison of different feature extraction methods for EEG-based emotion recognition. Biocybernetics and Biomedical Engineering, 40(3), pp.910-926. CrossRef
Cheah KH, Nisar H, Yap VV, Lee CY. Convolutional neural networks for classification of music-listening EEG: comparing 1D convolutional kernels with 2D kernels and cerebral laterality of musical influence. Neural Computing and Applications. 2020 Jul;32(13):8867-91. CrossRef
Nisar H, Hoe TC, Nawaz R. Reducing Sensors in Mental Imagery Based Cognitive Task for Brain Computer Interface. In2020 14th International Conference on Signal Processing and Communication Systems (ICSPCS) 2020 Dec 14 (pp. 1-10). IEEE. CrossRef
Nisar H, Ch’ng YK, Chew TY, Yap VV, Yeap KH, Tang JJ. A color space study for skin lesion segmentation. In2013 IEEE International Conference on Circuits and Systems (ICCAS) 2013 Sep 18 (pp. 172-176). IEEE. CrossRef
Hall, P., Park, U. and Samworth, J., 2008. Choice of neighbor order in nearest-nerighbor classification. Annals of Statistics, 36(5), pp. 2135-2152. CrossRef
 , Humaira Nisar*