Early Prediction of Potato Leaf Diseases Using ANN Classifier
Kumar Sanjeev1, Narendra Kumar Gupta1, W. Jeberson1 and Suneeta Paswan2
1Department of Computer Science and Information Technology, Sam Higginbottom University of Agriculture, Technology and Sciences, Prayagraj-211007, India
2Subject Matter Specialist, Krishi Vigyan Kendra, Saharsa-852201, India
Article Publishing History Article Received on : 07 Oct 2020 Article Accepted on : 12 Dec 2020 Article Published : 30 Dec 2020 Plagiarism Check: Yes
Article Metrics
ABSTRACT:
Potatoes are cultivated in several states of India. Potatoes provides a low-cost energy in human diet. Potatoes are used in industry for making dried food products. Early blight and Late blight are major disease of potato leaf. It is estimated that the major loss occurred in potato yield due to these diseases. In this research, we have collected sample of potato leaf images from Plant Village dataset. This dataset contains 2152 images of potato leaf. It has 3 class of sample of Healthy Leaf, Early Blight and Late Blight. The 76 features are extracted from these images regarding color, texture and area. The extracted features are used to develop a classifier. The developed classifier is based on neural network for prediction and classification of potato image samples. The Feed Forward Neural Network (FFNN) Model is used for prediction and classification of unknown leaf. The accuracy of model is achieved 96.5%. Classifier is helpful in early and accurate prediction of the leaf diseases of potato crop.
Sanjeev K. Gupta N. K, Jeberson W, Paswan S. Early Prediction of Potato Leaf Diseases Using ANN Classifier. Orient.J. Comp. Sci. and Technol; 13(2,3).
Copy the following to cite this URL:
Sanjeev K. Gupta N. K, Jeberson W, Paswan S. Early Prediction of Potato Leaf Diseases Using ANN Classifier. Orient.J. Comp. Sci. and Technol; 13(2,3).Available from: https://bit.ly/3mz6iqv
Introduction
The world population are growing now a day rapidly. The world population will be stretched 9.1 billion in 2050. There will be a time emanates where world population will be faced for food scarcity. World organization should be worked together on agriculture to feed the world population otherwise on this earth human being will be faced a major problem for sustenance their lives. India one of them is most populated country. In India, 70% of population depended on agriculture. Due to diversity of climate, in India different types of crops are cultivated here. So, farmers are able to grow wide range of cereal, fruit and vegetable crops (Patil and Kumar, 2011). Potato is very popular for vegetable crop in the world. Potato is considered as poor man’s friend. Potato are cultivated in several states of India. Potatoes are very economical food. Potatoes provides a low-cost energy in human diet. They are rich source of starch, vitamins C, B1and minerals. Potatoes are used in industry for making dried food products. The growing of these crops is highly technical. Early blight and Late blight are major disease of potato leaf. It is estimated that the major loss occurred in potato yield due to these diseases. The farmers want more yield and quality produce. It is estimated that crop yield loss 10% per year due to the diseases. It is also estimated that crop yield loss reached up to 20% in severe disease affected crop. The management of crop requires more close monitoring. The farmers will be more expert for management of crop diseases. The disease can affect production of the crop and subsequently the post-harvest life of crop. Crop diseases are a major threating to food security. The rapid and accurate identification of disease are remains difficult. These problems created due to the lack of the necessary infrastructure in the field of agriculture (Mohanty et al., 2016). This problem can be minimized or solved by recent advances in technology. These technologies are image processing and computer vision. These technologies can be utilizing in agriculture fields for identifying disease. Farmers can minimize their yield loss due to diseases with help of these technologies. They are able to early and accurate prediction of disease with help of disease diagnosis assisted system.
Review of Literature
(Rowe et al., 1987) Authors explained in their research work that potato crop has been facing a problem in production for a number of years. This has occurred due to the premature vine death. This caused a declining in yields. This disease also called “early maturity wilt”. The production of potato has reduced in several areas. The cause of this disease is soil born fungus. The name of this soil born fungus is Verticillium. Two species of this fungus are responsible for disease. These two species are V. albo-atrum and V. dahlia. The control plans of this disease are based on understanding of the pathogen’s biology and the selection of different agricultural practices for management of disease.
(Dacal-Nieto et al., 2009) Authors describe about a system which is useful for quality control of potatoes with help of computer vision technology. They utilized the image processing method. They have performed segmentation of potato images. They specially considered color and projections for segmentation of images. After that, they extracted features from segmented images from HSV and RGB channels. A learning set has been created with help of co-occurrence matrix texture characteristics and histogram. The 1-NN algorithm is used for development of classifier. An ad-hoc GA is used for feature selection. GA is helped in reducing the dimensional complexity. Therefore, it will be possible to optimized the classifier goal.
(Al-Hiary et al., 2011) The authors proposed about automatic system for detection and classification. They considered about plant leaves diseases. They were mainly focused on colour feature of images. After segmentation of images, they identified the green pixels of images. They applied Otsu’s method for masking the pixels which were based on specific threshold values. They explained that proposed method is robust for identifying the diseases. The proposed model gains a precision between 83% and 94%.
(Raut, S. & Fulsunge, A., 2017) The researchers explained about recognition and classifying technique of plant disease. They worked on leaf and fruit diseases of plant. They used MATLAB software for analysis of dataset of images. They applied K-means method and Multi SVM. The K-means is used for clustering and SVM is used for classification. Proposed algorithm provides high accuracy in less time for processing of application.
(Mirchandani et al., 2018) The authors worked on seven diseases of affect plant leaves. They applied K-means clustering method for segmentation of leaves images. Neural Networks employed for classification of diseases. They have used two algorithms of Neural Networks. These algorithms are Feed Forward and Cascaded Feed Neural Networks Algorithm. These two classifiers were tested on seven diseases which affected the plants. These two models were performed well for detection of diseases. Cascaded Feed classifier was performed better than another classifier.
Materials and Methods
Image Processing Techniques
The image processing is very useful for agriculture field. It can be used for disease, insects identification and determining the shape and size of fruits of different crops. The image processing technique is consisting of different steps like Image Acquisition, Image Preprocessing, Image Segmentation, Feature Extraction and Image Recognition.
Image Acquisition
Dataset of Potato Leaf Image
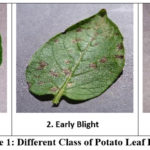
In this research, we have collected sample of potato leaf images from Plant Village (www.plantvillage.org). It is a publicly available image database. This database contains 2152 images of potato leaf. It has 3 class of sample of Healthy Leaf, Early Blight and Late Blight shown in figure1. The detail information of dataset is given in Table1. We considered all images for analysis purpose.
In Image Preprocessing, generally, we have done to remove the noise of the sample, resize the images as par requirement and filtering the images and to do image enhancement for better viewing the processed image than the original image. Image enhancement can be done with spatial domain and frequency domain methods. Spatial domain is related with manipulation of pixel values of an image whereas frequency domain is related with manipulation of frequency values of images. Frequency domain is computed with help of Fourier transform and inverse Fourier transform techniques of the image.
Image Segmentation
Image segmentation is used for partitioning of image into multiple region. That divided regions refers to a problem specific. This region of interest shows diseased region or your objective region. Image segmentation can be done various method like clustering methods, histogram-based methods etc.
Feature Extraction
The features are very useful in identifying one class of objects to another. In this present work we have extracted color, shape and texture features of images. The total number of extracted features are 76. These features are utilized for training of models. Hence, these features are helpful in to get accuracy in disease identification. We considered as following features
Colour Feature
Color image processing is divided into two major areas: full color and pseudo color processing.
Gray level
It refers to a scalar measure of intensity that ranges from black to grays and finally white. The RGB image was renovated to a gray image, and the following conversion formula are used:
Where, R = Red, G =
Green, B = Blue
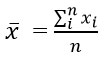
The RGB mean, variance, and range are computed using the following expressions
Mean
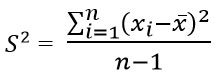
Variance
Variance is another measure of the spread of data in a data set. In fact, it is almost identical to the standard deviation. The formula is this:
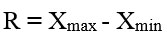
Range
Texture Feature
The texture is the set of the pixel which has been frequent characterize. The texture feature methods are classified into two categories. The spatial feature extraction and the spectral texture feature extraction. We considered statistical methods like Mean, Standard Deviation, Smoothness, Skewness, Kurtosis, Root Mean Square, Inverse Difference Moment, Energy, Contrast, Homogeneity and Variance for texture feature extraction of images.
Shape Features
It is a set of measurements that describe a certain shape according to some of its fundamental geometric properties. We considered geometrical methods like Aspect Ratio, Rectangularity, Area ratio of convex hull, Perimeter Ratio of Convex Hull, Sphericity, Circularity, Eccentricity and Form Factor for shape feature extraction of images.
Image Recognition
Classification is a process, in which one objects distinguished from another. In this research, we employed artificial neural network (ANN) classifier. ANN is a function, in which neurons are passed as input values through function and get output. Weight values of neurons are computed in each layer of ANN and compared with target. It can be optimized or minimized by activation function to get the objective. In artificial neural network (ANN), the net input can be calculated as
Confusion Matrix:
Precision
Rate (%) = (TP / TP + FP) *100 where, TP is True positive, FP is False positive
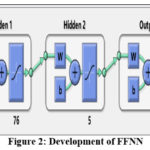
Here, we have used a dataset of potato leaf image which has 2152 image sample. This dataset has 3 class of sample of Healthy Leaf, Early Blight and Late Blight. 76 features are extracted from these images and feed the feature extracted as input. After manipulating neurons and its weights with help Feed Forward Neural Network (FFNN) Model, it creates input layer, two hidden layers and output layer. The analysis of research work has been done with help of Matlab 2017a software. Details of model development are illustrated in Figure 2.
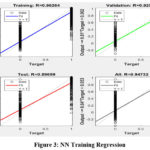
We have 2152 total sample. For developing model, we have divided sample as 70%, 15%, 15% for training, validation and testing respectively. For research purpose, we considered 20 iteration. Performance goal met at epoch 11 during iteration of model. Figure 3 shows that in training, model achieves 96.26% goal between target and output, in validation, model achieves 92.5% goal between target and output, in testing, model achieves 89.69% goal between target and output and in over all, model achieves 94.73% goal between target and output.
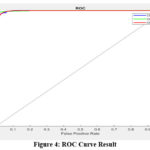
ROC stands for receiver operating characteristic (ROC). It is a graphical plotting representation which illustrates performance of binary classifier system as its discrimination threshold is varied. The Figure 4 demonstrates the analysis regarding the performance of ROC curves. The curve is formed by plotting true positive rate (TPR) against the false positive rate (FPR) at various threshold settings. The curve of 3 class represents the how better curve falls under correctly identified class and incorrectly identified class.
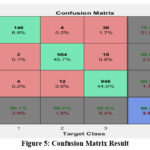
Here, confusion matrix has been plotted between target and output class. Figure 5 shows the confusion matrix result in which class1 reveals 78.5% precision rate, class2 reveals 98% precision rate and class3 reveals 98.3% precision rate. The accuracy of classifier is 96.5%. Hence, we can say that classifier is helpful in early and accurate prediction for identifying the leaf diseases of potato crop.
Conclusion
Crop diseases are a major threating to food security. The rapid and accurate identification of disease are remains difficult. This problem can be minimized or solved by recent advances in technology. These technologies are image processing and computer vision. Early blight and Late blight are major disease of potato leaf. It is estimated that the major loss occurred in potato yield due to these diseases. In this research, the develop classifier is based on neural network for prediction and classification of potato image samples. The Feed Forward Neural Network (FFNN) model is used for prediction and classification of unknown leaf. The accuracy of developed model is 96.5%. Classifier is helpful in early and accurate prediction of the leaf diseases of potato crop.
Acknowledgement
The
authors would like to extend gratitude to Sam Higginbottom University of
Agriculture, Technology & Sciences for this work.
Conflict of Interest
There is no conflict of interest from authors sides.
Funding Source
Authors did not receive any financial support for the research and publication of this article.
References
Al-Hiary, H., Bani-Ahmad S., Reyalat, M., Braik, M., ALRahamneh , Z. (2011). Fast and Accurate Detection and Classification of Plant Diseases. International Journal of Computer Applications, Volume- 17, No.1, 0975 – 8887. CrossRef
Athanikar, G., Badar, P. (2016). Potato Leaf Diseases Detection and Classification System, International Journal of Computer Science and Mobile Computing, Vol. 5, Issue. 2, pg.76 – 88.
Chahar, R., Soni, P. (2015). A Study of Image Processing in Agriculture for Detect the Plant Diseases, IJCSMC, Vol. 4, Issue. 7, pg.581 – 587.
Dacal-Nieto, A., Vazquez-Fernandez, E., Formella, A., Martin, F., Torres-Guijarro, S., González-Jorge, H., (2009). A genetic algorithm approach for feature selection in potatoes classification by computer vision. IEEE, Spain, 2009, 1955-1960. CrossRef
Dickson, M.A., and Bausch, W.C. (1997). Plant recognition using a neural network classifier with size and shape descriptors”, Transactions of the ASAE, vol. 1, pp. 97-102.
Durga, N. K., Anuradha, G. (2019). Plant Disease Identification Using SVM and ANN Algorithms, International Journal of Recent Technology and Engineering, Volume-7, Issue-5S4, pp. 471-473
Mirchandani, S., Pendse, M., Rane, P., Vedula, A. (2018). Plant Disease Detection and Classification Using Image Processing and Artificial Neural Networks. International Research Journal of Engineering and Technology, Volume: 05 Issue: 06, 2859-2864
Mohanty, S. P., Hughes, D. P., Salathe, M. (2016). Using Deep Learning for Image-Based Plant Disease Detection. Frontiers in Plant Science. 7:1-10. CrossRef
Patil, J. K., Kumar, R. (2011). Advances in Image Processing for Detection of Plant Diseases. Journal of Advanced Bioinformatics Applications and Research. 2(2):135-141.
Raut, S., Fulsunge, A. (2017). Plant Disease Detection in Image Processing Using MATLAB, International Journal of Innovative Research in Science, Engineering and Technology, Vol. 6, Issue 6, 10373-10381.
Rowe, R. C., Davis, J. R., Powelson, M. L., Rouse D. I. (1987). Potato Early Dying: Causal Agents and Management. The American Phytopathological Society, Plant Disease. 71 (6): 482-489. CrossRef