QoS Priorities in ERP Implementation – A Study of Manufacturing Industry of Nepal
Introduction
In this rapid changing world,
economy has amplified the demand for corporations for supplying the merchandise
a lot of swiftly and with better quality whereas decreasing prices to get high
consumer satisfaction. For transitory relief regarding hike in costs can only
be fixed by downsizing, outsourcing, etc. To run in the race of competition,
many of the organizations are making their advance level work process with
proper decision from top management committee. Different sized organizations
whether it be top grade or mid-size organization they are involving in adopting
latest ERP software having broad-minded investments.
ERP is such a system which helps
business process in terms of well-designed software with proper integrate
within different departments and branches which incorporates HR, monetary,
financial, sale & supply, project & material management, SCM, QM
(Shehab, Sharp, Supramaniam, & Spedding, 2004). Manufacturing defines a
process of remodeling fresh materials to polished merchandise available. It
covers the assembling process with assimilation of specified parts for better
product (Blanchard, 2012). Firms should use latest information technology for
continuous support with enhancement in business process leads to compete in
rapid changing world. For managing organizations in terms of information, ERP
has become the latest system of PC tools with excellent features. It combines
the processes, information among different units also with different
functionalities, branches, companies and also with any geographic locations.
Quick response, on-time delivery, inventory management, interaction between customer
and suppliers are some of the advantages of ERP. (Gupta & Kohli, 2006)
explained their view saying “ERP adopts business processes in the
decision-making process and integrates all the useful components of a company,
sales, marketing, production, operations, logistics, purchases, finance, new
developments and human resources.” It helps good electronic commerce facility
whic h ensures proper business growth with great level of client service and
good productivity applying less inventory & price (Su & Yang, 2010).
ERP of manufacturing companies has
encountered a series of challenges that affect the pursuit of business
objectives including operational strategic positioning and effectiveness.
National Association of Manufacturers (NAM, 2011) patent the need for available
skilled labor are vacant as nearly 5% of all manufacturing jobs and 82% of all
manufacturers have a shortage of skilled production workers. Untimely and
fragmented communication among higher management, employees, and different
stakeholders contributes to fade productivity and method inefficiencies yet.
Sufficient training and education (TED) will maximize the performance of
workers by reducing the time needed to find out and operate new systems,
however, because of restricted budgets and resource concerns, corporations are
usually forced to solely part fulfill coaching desires. The implementation of
ERP makes significant changes to the management of business processes. ERP
implementation makes modification in business process board. Top management
commitment in ERP implementation and equal effort is required for effective
system.
For successive variations in the
market many organizations are performing highly advanced agility work to
enhance capability by changing and modifying verdict making process. During
last few decades, a large number of corporate firms and organizations used ERP
system in order to expand further as technology takes a hike (Karim, 2011).
ERP’s systems area unit designed with the hunt to boost productivity by
enhancing associate organization’s ability whereas generating correct and
timely info across the enterprise, and everyone its offer chain. The productive
ERP systems implementation will result to lower inventories, cut back
development cycle, improve client service, increase potency (productivity),
improve gain and improve effectiveness through higher client services (Beheshti
& Beheshti, 2010).
Researchers have developed different
success model (such as ERP) information systems. After verifying different
models, DeLone and McLean are the best choice model by many researchers. A
study was conducted by DeLone and McLean on IS success representing qualitative
behavior of it, user interaction to information systems (user satisfaction),
consumption of the output (use), impact in organization & impact on
individual (Bernroider, 2008). As a result, it was demonstrated inconsistent
empirical results with one another.
In a competitive era, there is
required of new product having some modification than older one within less time
frame which are making many corporations under pressure to shift demand.
Similarly, launch of new products is increasing complexity to industries. Due
to different functionality and working module of an organization it has become
difficult to coordinate with other organization (Gattiker, 2007). There are
numerous ways to respond to manufacturing companies. First response, to
increase inventory buffer and capacity (Thompson, 1967) (Pagell, Newman, Hanna,
& Krause, 2000). The second response, to make easy with production and
other processes (Sakakibara, Flynn, Schroeder, & Morris, 1997). (Hauptman
& Hirji, 1996) suggests the third one which relates to increasing
integration. In Manufacturing-Marketing (MM) interface, ERP delivers large
payoffs which answer how and where issues.
Background of the Study
In the 1990s, the term ERP was used
for the first time, capable of dealing with other commercial functions such as
finance and accounting, engineering. Management of human resources and
projects, etc. In 1940’s its history began by using calculating machines for
business. In 1960’s applications were introduced that can easily control and
handle inventory management. IT partner IBM & J.I. Case (tractor
industrialist & other manufacture machines) performed combined effort which
further created software named as Materials Requirements Planning i.e. MRP
(Joshi, 2017).
Varieties of elements are
incorporated in ERP software package i.e. economics and production, human
resources, sales, integration of data depending upon business processes also it
can be customized on-demand or specific needs of an organization. ERP system
allows sharing databases in different business units with different orientation
depending upon divisions like accounting and sales uses same information for
their needs (Esteves & Pastor, 2001). As ERP software offers some ways of
synchronizing report and automation. To understand the performance of the
business environment, dashboard is the primitive feature of ERP which helps to
quick overview of current business situation. To acquire high market place, an
enterprise needs to perform work actions in Data Quality. Data Quality (DQ)
uses dimensions for better quality are completeness, instance accuracy,
accessibility and timeliness (Rothlin, 2016). Data Quality problem is one of
the difficult portions to be handled by organization which generally occurs due
to Data errors i.e. Conceptual (design) and Operational problem.
Problem Statement
Most of the manufacturers put hard
effort to follow complex processes for increasing overall productivity and
profitability which makes idea of great profit with time but streamlining
long-established processes can be time-consuming endeavor and daunting. From
the beginning, precise quality programs and new technologies are placed by
manufacturers properly so that it makes easier for them to improve processes
& get sudden benefits.
Lack of ERP system quality has a
high risk to get employee satisfaction in the business world. Before releasing
the ERP system many companies usually conduct different continuous tests.
Normally ERP companies have spent lots of time testing and debugging.
It’s a huge disadvantage for
companies to test the system using project budgets (Rothlin, 2016). Critical
ERP implementation, testing, and volume occupy nearly 50% of the total ERP
budget due to lack of Quality Assurance and Quality Control methods.
Research Questions
How ERP is helping the manufacturing
industry to manage and support the value creation of product?
What is the efficiency of the ERP
system in terms of quality?
How is the service provided by ERP?
Purpose of the Research
This research relates to a different
aspect of Quality of Services in terms of ERP implementation especially in
Manufacturing Industry of Nepal. It also helps to find out the acceptance of
good productivity as claim by ERP support team. This research aims to find out
the gaps and challenges while using ERP with its pattern in manufacturing
industry in Nepal.
Objectives of the Research
Successful ERP system implementation
maintains standardization of product which achieves high quality. Continuous
Quality Controlling and Quality Assurance methods help to maintain standard
quality (Arachchi, Chong, & Madhushani, 2015). ERP systems face failures,
risks because of no proper testing, tangibles, conformance, assurance,
responsiveness, courtesy, serviceability, reliability, etc. This survey is
going to identify on the following basis:
To understand the current ERP usage
in the manufacturing industry of Nepal.
To find the challenges of ERP
implementation in the manufacturing industry.
Scope and Limitation of the Research
The scope of this research is to
find the gap of using ERP system between different manufacturing industries of
Nepal. The main motive for this research is to look after different ERP system
usage feedback by different manufacturing industries i.e. Cigarette factory,
Noodles & Alcoholic Factory, Herbal Factory, etc.
Implication of the Research
This research aims to find the
difficulties performed before and after ERP (Enterprise Resource Planning)
system implementation. Also, to evaluate the different quality of service
priorities after ERP implementation. The research tends to result in a
beneficial choice of ERP system, especially to the manufacturing industry.
Research Design and Methodology
Research Methodology
It is viewed as one of the leading
research tools. It indulges research approach, research strategy, philosophies
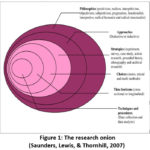
of research methodology, time limit and choice. The research onion of
(Saunders, Lewis, & Thornhill, 2007) is to be formulated for giving
comprehension of the research methodology which is going to be used in dissertation. Ontological,
epistemological and axiological research are the methodological choices which
is to be kept in mind while doing research. In this chapter, we will talk about
the research philosophy, approach, strategy, data collection and analysis
techniques which were utilized in this research.
Research Plan and Design
To carry out this investigation, a
descriptive and explanatory investigation is carried out. This research is
mainly evaluated based on a primary survey. An expert suggestion on the need
for research was considered exceptional for the questionnaire. The study is
based on several statistical tests such as correlation, regression, average,
standard deviation, among others. The software called Statistical Package for
Social Sciences (SPSS) and Microsoft Excel was used to analyze and interpret
quantitative data. This software is commonly used by researchers easily
available in a corporate environment. Scale reliability is analyzed using
Cronbach’s alpha since Cronbach’s alpha test is the best fit for multi-scale
articles and is also the most popular test for reliability of consistency
between articles.
Research Approach
Different procedures took to conduct
the research which is the primary concern of the research approach. The
existing approaches i.e. deductive and inductive which will be helpful while
conducting research. The first approach is inductive by collecting data based
on the method of findings and observations which is relevant to the topic.
Research Strategy
(Saunders, Lewis, & Thornhill,
2007) says that the research strategy incorporates the survey, case study,
experiment, grounded theory, action research, ethnography and lastly archival
research. Each method data is combined and inspected from one approach then
onto next. Each and every research strategy can be connected to each other
where all can be easily explainable. Combination of both qualitative and
quantitative approaches with new statistical tools are frequently increasing
strategic management. Qualitative data enrich and colors the analysis and
interpretation of such phenomena whereas quantitative data attracts the
underlying objective facts that give evidence of the phenomena
(VARGAS-HERNÁNDEZ, LEÓN, & VALDÉZ, 2011).
Data Collection
Sampling Methods and Sample Design
A superiority is given to primary
data collection method in this research. This type of data is firstly used for
testing assumption and after that helping out to support researcher privilege.
For the support of primary data, researcher can use secondary data as per
required.
A survey method was approached for
the study of vivid research. To get quantitative data, the result obtained from
collected questionnaire were administered. For the mode of administration, both
paper based & e-survey methods were formulated. In paper-based survey,
researcher personally visits and provides the respondents a hardcopy of the
questionnaire. Using internet as a mediator a survey was conducted where the
questionnaire links were sent to respondents.
The objectives of the research
guided the overall survey and study as objectives are mentioned in the
beginning of the chapter. The respondents were directly related to the ones who
use ERP system. The age band of 20 to 50 years above. Therefore, the level of
understanding of the respondents was considered during the sample design. The
researcher distributed one hundred and fifteen (150) online questionnaires to
the interviewees, of which one hundred and fifteen (115) responded, while the
same survey was distributed manually to seventy (70) people and only fifty-two
(52) responded. In total, one hundred and sixty-seven (167) people responded to
the survey of two hundred and twenty (220) sent to answer.
Data Collection Methods
With the help from literature, web
engines, papers, and views through questionnaires as filled up by officials
& staffs of manufacturing industries & public for adopting the plan
primarily.
Primary & Secondary data are the
2 different sources for the collection of data.
Data Capturing and Data Editing
Primary Data
Using subsequent techniques primary
data will be collected:
Questionnaire
Well-structured questionnaire for
executive, manager, and employee of manufacturing industry will be prepared.
The questionnaire includes the questions regarding quality of services provided
after ERP implementation which incorporates service, feasibility, adaptability,
changeability and so on in manufacturing industries of Nepal.
Interview
The interview will be conducted with
the executives, managers, and employees of manufacturing industry of Nepal to
understand the views in details.
Observation
For better understanding, a running
system will be observed on the site visits of the manufacturing industry of
Nepal. The participation of the officers, employee, and public in actual
implementation of the system, will be observed. The concrete pros and cons of
the system will be deeply observed.
Secondary Data
From the following sources it has
been taken help for collection of secondary data:
Reference Books
The researcher will study various
books and references related to ERP implementation in the manufacturing
industry, Enterprise Resource Planning Systems and User Performance, Quality
Assurance and Quality Control in ERP Systems Implementations, An Information
Processing Theory View of ERP, Critical success factors in the implementation
of ERP system, etc.
Journals & Research Papers
Various journals and research papers
will be referred.
Internet Source
Internet sources will be viewed for
better understanding about benefits, framework, working principle, procedure,
features, Business operations, etc. of ERP especially in the manufacturing
industry all over the world.
Design of the Interview and questionnaire question
To the respondents, a well-designed
questionnaire was prepared and shared. As mentioned instructions, respondents
filled up the questions. After the completion of questionnaire, it was
collected from them. Very less time will be taken to fill up the questionnaire
as it contains closeended questions. For the easiness to response the answer
without any biasness the questions were mostly measured using 6 rating i.e.
Likert Scale (1(strongly disagree) to 6(strongly agree), with disagree, and
agree as interval points) and also with Yes/No options.
Data Collection Limitation
During the interview, the
interviewee would provide an answer based on his/her experience and knowledge
which might be biased.
When using the questionnaire, the
participants are restricted to the options given in the questionnaire.
Also, when using the questionnaire,
the answers might not be fair enough if the correspondence is an influence.
Data Collection Assumptions
The participants are randomly chosen
to represent the entire manufacturing industry of Nepal.
The participants are primarily
chosen especially with IT background with related minimal knowledge to the
research domain.
Reliability and Validity
Research validation in regard of
design and plan are verified with discussion of experts also, before taking
startup to investigation portion there was the development and tested the
research instrument. With the discussion of my supervisor, questionnaire was
formed. In consider with research
question, all the items were properly designed. To find out correctness of data
both reliability and validity are incorporated. A true measurement which
represents characteristics refers to validity. Some samples will be collected
to measure exterior validity. To grasp the customer’s perception with maximum
content validity there were performed comprehensive literature review.
Reliability refers to item, scale or instrument correlation with a hypothetical
one which measures what it is supposed to be. P-value is compared in terms of
0.01. If p value is less than 0.01, the null hypothesis is rejected else if it
is equal to or more than 0.01, the null hypothesis is accepted. Means were also
compared to assess the reliability of scales. The value ranges between 1 to 6
and the mean is 3.5. Generally, it is thought that the mean value more than 3.5
is positive response, the mean value 3.5 means adequate and less than 3.5 is
negative response. The values are if above 3.5 it can be concluded that the
scales are reliable.
Limitations
There were some limitations during
data gathering and analysis process. One of the limitations was that it was too
difficult to get full participation, as most of the participants did not fill
up the questionnaire. The original time planned for data gathering was one
month but due to some unforeseen reasons, the data collection took more than one-month
time period.
Research Timeframe
There are only two types of research
timeframe i.e. longitudinal or cross-sectional timeframe whereas longitudinal
timeframe is useful for those research which takes much longer period but it
quite different with cross-sectional timeframe i.e. it is useful for those
research that takes a limited timeframe. A longitudinal study is additionally
associate empiric analysis technique that gathers knowledge for identical
subjects repeatedly over an amount of your time because it will extend over
years or even decades (Rouse, n.d.). The cross-sectional study design allows
researchers to compare different variables at the same time as looking at
gender, age, income, and educational level. It may not provide definite information
about cause and effect relationships (Institute for Work & Health, 2019).
The timeframe which is allocated for the research to be carried is actually
research timeframe. It gives time for gathering data and what must be achieved.
Only for gathering data exercises will not be more than 21 days. If there is a
delay in data gathering, the result would be matched against total expected
result and once the participant limit covers 75% feedback, then it means your
data is valid and can be used without waiting for remaining feedback result.
Ethics and Confidentiality
Ethics and confidentiality is a very
careful portion which is important to state the reason why a particular data is
to be collected. Safety of each data becomes very important whereas confidentiality
involves keeping data safely after gathering from a group of people where no
other can have access to it. For the purpose of this research, different data
were collected from varied manufacturing industry and kept safely as
confidentiality. All the collected data were utilized for the purpose of
research and no other purpose. Being trustworthy, no data were shared with any
person, group or organization. All of the participants were clearly informed
and explained why such information is being collected and for what purpose it
is used for.
Data Analysis And Findings Of Research
Mode of Analysis
Quantitative data analysis methods
were usually used for questionnaire data analysis which was utilized to analyze
statistical data and after that collection of interview data was done. A
researcher essential portion is to analyze and interpret data that relates to
modifying data which explains the solution to the research question. For the
data, both the analysis i.e. qualitative and quantitative approaches are going
to help for achieving (Akande, April, & Belle, 2013). There are different
tools available for analyzing the quantitative data i.e. SPSS, MATLAB, PSPP,
Microsoft Excel, Google Analytics, Stata, etc. Semiotics, hermeneutics,
narrative and thematic analysis are different modes available for analyzing the
qualitative data. To analyze & interpret the data, Statistical Package for
social science (SPSS) and Microsoft Excel are the software which was used.
Commonly researchers use this software as it is easily available with business
setting. These tools were very fruitful and useful throughout the data
transcription and habituation.
Overview Analysis of Questionnaire
Results
Questionnaire Duration
Each questionnaire duration was of
thirty (30) minutes and the participants.
Profile of Participants
For the questionnaire, the
contributors were from the manufacturing industry and some expertise from IT
industry, which has the knowledge of ERP whereas employees of manufacturing
industry were not filtered with specification of departments.
Number of Participants
Online survey and manual
distribution survey was carried out which was made accessible and available for
the participants. The researcher distributed one hundred fifty (150) online
questionnaires to respondents out of which one hundred and fifteen (115)
responded whereas the same survey was also distributed manually to seventy (70)
individuals and only fifty-two (52) responded to it. In total one hundred and
sixty-seven (167) individual responded to the survey out of two hundred and
twenty (220) send for response. The validity for use was set more than 75% for
better accuracy. The result is given below.
Analysis
The analysis is necessary to find
the gap of ERP implementation in different manufacturing industry also with the
services are as the vendor has promised them. The questionnaire is usually used
to get an opinion from different sectors of individual especially in
manufacturing industry regarding ERP. It also lets participants share their
feeling about ERP as they are always the prospective user. Altogether there are
Forty-seven (47) questions out of which only twenty-five (25) questions are
structured below.
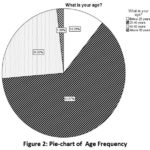
Table 1: Age Frequency
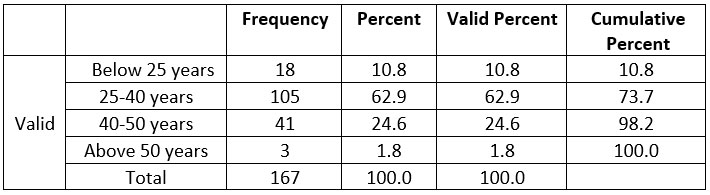
In this research, it has been found
that most of the participants i.e. 105 in the survey is of 25-40 years range
which is 62.9% all of the total 167 whereas 24.6% respondent of age range 40-50
years, 10.8% of age below 25 years and lastly 1.8% respondent of age above 50
years.
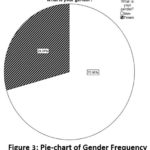
What is your gender?
Table 2: Gender Frequency
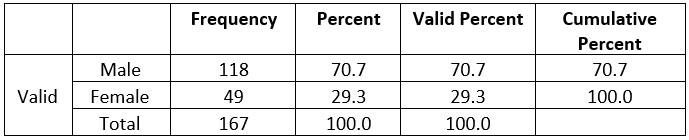
The table clearly shows that out of
total of 167 respondents, 118 were categorized under Male field with 70.7% of
total participants whereas 49 respondents were categorized under Female with
29.3% of total participants. To represent the data more clearly graphical
representation of gender-wise distribution is shown above.
What is the level of your education?
Table 3: Level of Education Frequency
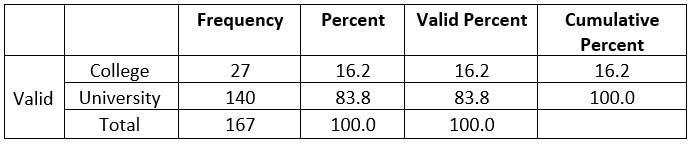
According to the survey, most of the
respondent is of University level which might make the result more effective.
As 140 respondents have University level education whereas the remaining 27
respondents have got the knowledge of College level education.
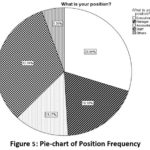
What is your position?
Table 4: Position Frequency
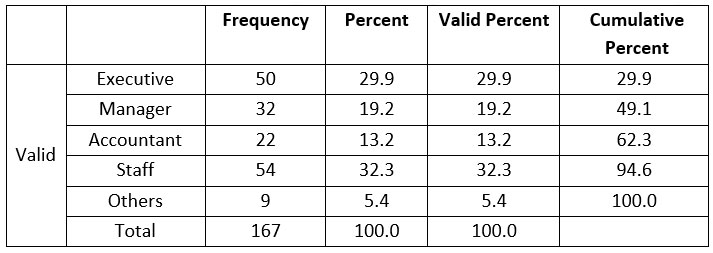
We have a variety of position and so
some are listed accordingly as common. Hereafter in the survey, out of 167
total participants 54 respondents were staff i.e. 32.3%, 50 respondents were
executive i.e. 29.9%, 32 in total respondents were manager i.e. 19.2%, 22
respondents were accountant i.e. 13.2% and ending up with 9 others position
employee with 5.4% respondent. In the survey, we have similar frequency of two
different positions which has absolutely different roles comparing together
i.e. Executive and Manager, this might help to get different perspective from
both the sides which might make me easier to get with objectives.
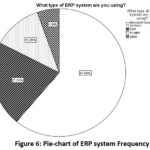
What type of ERP system are you using?
Table 5: ERP system Frequency
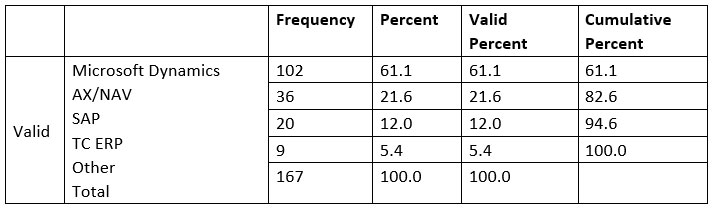
Different ERP software were listed
out to the respondents, whereas most of the manufacturing industry uses
Microsoft Dynamics AX/NAV i.e. 102 respondents choose this system i.e. 61.1%,
SAP (Systems Applications and Products) system were chosen by 36 respondents
i.e. 21.6%, TC ERP by 20 participants and other system by 9 respondents.
Looking after the result, most of the manufacturing is dependent upon Microsoft
Dynamics AX/NAV.
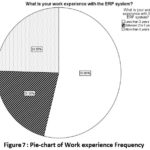
What is your work experience with the ERP system?
Table 6: Work experience Frequency
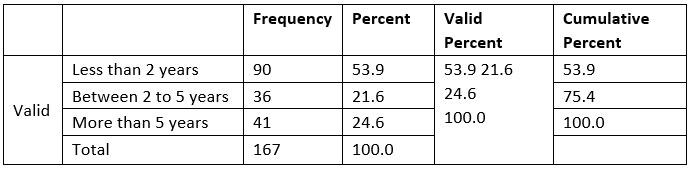
In the above table result, it can be
seen that 90 respondents i.e. 53.9% out of total 167 have less than 2 years’
experience with the ERP system, similarly, 41 respondents have more than 5
years’ experience and 36 respondents have the experience in between 2 to 5
years’. An emerging technology requires the individual to get updated rapidly
as the number of respondents is higher who has less than 2 years’ experience
regarding ERP makes them know about system efficiently with changing features
to the system.
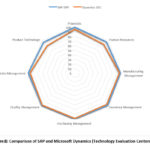
Analyzing ERP usage pattern
The SAP ERP versus Dynamics
Comparison Report facilitates the work of examining the first variations
between the 2 software system, however solely with reference to
characteristics. For that reason, your comparison chart does not account for
your group’s priorities, no matter the result they may wear the ultimate
outcome. This ought to be thought of should your organization need to perform a
lot of thoroughgoing comparison method. The subsequent features and
functionalities are listed below:
Economic
Humanoid Resources
Manufacturing Management
Record Management
Procuring Management
Superiority Management
Deals Management
Merchandise Technology
Let’s take a closer look at each of the eight
domains.
Economic
SAP ERP is appreciated because
comparing with Dynamics it is powerful contender in terms of features and
functions of economic.
Human Resources
According to some study, SAP is
found with high ranking than Dynamics. In terms of Humanoid Resources options
and functions that area unit offered off the shelf as SAP has also excelled in
it.
Manufacturing Management
Both SAP ERP and Dynamics offer
comparable coverage of Manufacturing Management functions and features.
Inventory Management
SAP ERP slightly eclipses Dynamics
in terms of Inventory Management features and functionalities.
Purchasing Management
The two software supply similar
coverage of buying Management options and functionalities; they each give
comparable coverage of capabilities during this module.
Quality Management
Again, neither software stands out
here. Both Dynamics and SAP ERP have nearly the same support for Quality
Management features and functions.
Sales Management
SAP ERP slightly outperforms
Dynamics in the Sales Management module.
Merchandise Technology
In this field, we have found that
SAP obtains higher rating than Dynamics. Here we see that SAP ERP excels with
regard to functionalities that are available off the shelf (Technology
Evaluation Centers, n.d.).
Overview Analysis of Interview Results
Interview Duration
As due to the busy schedule of
interviewees there was a time limitation which was almost an hour for each
interview. The participants were allowed to answer the questions in an open way
in order to avoid the researcher from influencing the response coming from the
participants.
Profile of Interview Participants
All the participants were from the
IT perspective of their respective manufacturing industry.
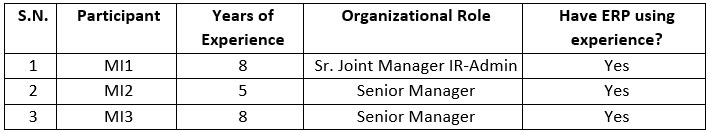
Below table represents the
participants’ role and years of experience. This research refers to
participants as MI1 and MI2 in order to ensure their confidentiality and that
of their respective manufacturing industries. Starting from three (3) years to
ten (10) years are the experiencing years by participants which makes them
involve with IT decision in their own manufacturing industries.
Table 7: Tabular form of Interviewee details
Sample questions to Interviewee
Below few questions are extracted as
a sample question which will be asked to the interviewee.
What are the challenges faced during implementation of an ERP?
Do you feel any changes in productivity after ERP implementation?
How effective services are provided by an ERP vendor?
List of visited industries
The below list are of different
manufacturing industries where the researcher visited for it survey and
findings.
Table 8: Tabular form of visited industries
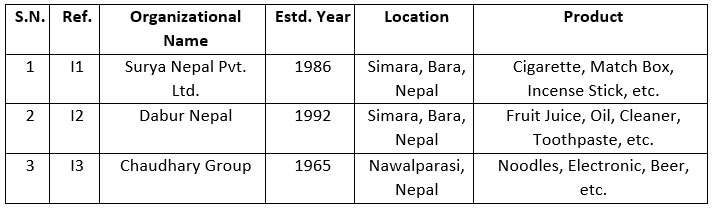
Number of Employees
The manufacturing industries where
the respective participants work are all large and famous in Nepal and in other
countries with ranging employees from 500+ to 5000+. The manufacturing
industries are referred to as I1, I2 and I3.
Participants by Role in IT Decisions
All the participants from the
manufacturing industries are involved in making IT decisions for their
respective workplace.
Participants understanding of ERP
Understanding of ERP by
participants, all of them have very good knowledge of ERP and were able to give
their view of ERP based on their experience. Some of the definitions of ERP by
the participants are:
According to MI1, “This software
package makes selections easier as a result of the integrated information is accessible
with slightly.”
According to MI2, “Tons of apps to
add and configure that makes the possibilities endless for what does and can do
to help our business grow and grow our business in the right direction with its
gorgeous visual charts and widgets and knowledge management.”
According to MI3, “ERP is very
versatile platform to make worldwide and standardized MES template”.
Data Findings
Technology
Security
It is the most essential factor to
consider when adopting ERP system, particularly for manufacturing industries.
The system holds the sensitive and confidential data of customers, employees,
and product. There are other more things to consider depending on the use case
as said by some participants. Some participants noted that cost and quality of
internet services are important for conduction of business activities. An
example gave by one participant was the need for continuous connection is
required for branch interconnection and for tracking products. Commonly,
security terminology was repeated by most of the participant several times
which show security is the most significant factors for manufacturing industry.
Architecture
The architecture of the ERP system
in some manufacturing industries are three-tier architecture and some have
web-based architecture. MI3 stated that they have their own local data center
for storing data with their functioning for the purpose of failover and to
minimize the downtime.
Quality of service
Quality of system specification and
Internet services are very important for ERP system to function effectively as
the ERP system requires a good processor with system compatible operating
system and some manufacturing industries requires good Internet service for its
reliability.
Organization
Impact on business value
Many respondents have agreed
regarding cultural change while ERP implementation. In terms of the business
value of ERP implementation, all of the participants have defined as essential
and measured with growth of production as well as satisfaction.
Skills
and Training
Proper understanding of system use
is one of the most essential parts for effective result. As ERP system is one
of the complex systems which requires trained staffs and expertise in computer
in terms of department wise. MI1 says for continuous improvement in
organization growth there should be skilled manpower and can be sharpened more
by training.
Business
Continuity and Disaster Recovery
ERP software provides disaster
recovery in itself with the features of time-time backup. Every ERP system has
its own plan and thought for recovering data from disaster. MI1 noted that
before deploying ERP in particular place you need a full documented business
continuity and disaster recovery plan. Quick recovery is essential as in many
organizations they don’t have any ability to do business without ERP working
smoothly (ERP Desk, 2015). Contingency plans required if primary disaster
recovery plan fails and also documentation need to cleared regarding whom to
contact when such disaster event occurs said by MI2.
Environment
Cost
Total cost estimation of an ERP
software solution requires careful asses manufacturing industry, not of an
array of variables which may vary widely from one organization to another
(WorkWiseSoftware, 2013). In terms of cost determination, it may also vary
based on unique requirements and the scope. Understanding the factors i.e.
maintenance, training, software customization, upgrades, support, process
redesign, etc. that will influence the cost of ERP. It will also help to get
better idea of business which can be paid as expected. Some participants said
that cost is very important as their goal is to spend less amount where
possible and believe to deliver the same or better quality of work.
Conclusions and Recommendations
Findings
To
understand the current ERP usage in the manufacturing industry of Nepal.
In the research, we have found that
neither software stands out here. Both Dynamics and SAP ERP have nearly the
same support for Quality Management features and functions. Both SAP ERP and
Dynamics offer comparable coverage of Manufacturing Management functions and
features.
One of the supreme significant
question which is the startup objective regarding current research. Different
ERP software were listed out to the respondents, whereas most of the
manufacturing industry uses Microsoft Dynamics AX/NAV system. Looking after the
result, most of the manufacturing is dependent upon Microsoft Dynamics
AX/NAV.
To find
the challenges of ERP implementation in the manufacturing industry.
There are numerous challenges where
every section has to be aware like different position employees should have
proper guidance and knowledge regarding ERP. If proper balancing is not done in
an organization, then it might lead to cultural change which may not be
adaptable to everyone. As ERP is a large software which might take more time
during implementation as it features with the integration system with different
departments. One of the biggest challenges is during ERP implementation which
takes a long time. In a survey, high number of respondents have agreed to say
large time is required during ERP implementation.
While implementing ERP, it needs to
be carefully managed because it may cause massive change. The below listed are
one of the challenging factors which needs to be carefully handled for
successful ERP implementation:
Vital Issues
Change in Structural (Process &
People)
Execution time & cost
Employees Self-esteem
How ERP
is helping the manufacturing industry to manage and support the value creation
of product?
As ERP is helping in different
factors of manufacturing industry which manages and support to create more
quality product. Continuous training is one of the basic requirement of every
organization where technology is emerging day by day so everyone should know
about it in their own field aspect. As an emerging technology the interface and
pattern keep on changing and it makes challenging to the user so most of the
respondents strongly agreed regarding continuous training which directly
implies in standard product. The quality factor is important assets of
manufacturing industries.
With the production, the
organization has to maintain its benchmark with its product. Competitive era
requires to maintain its standardization. So this research wants to assure whether
ERP is helping to maintain standardization of the product. According to survey,
it has been found that high priority is given for product standardization is
better than before whereas some are still confused to find the differences as
it might be due to ERP implementation was done currently. So as result ERP is
very frequently helping in standardization product.
What is
the efficiency of the ERP system in terms of quality?
Efficiency matters with the
monitoring to employees and verifying log reports by top management members.
Ranging from shop level to the root level of an organization ERP helps to
improve business enactment at all. It streamlines automatic operations in terms
of processing to production for gaining larger reflectivity on different aspects
of operations like from entry of order to production line, granary management,
and delivery. It also replies quickly to customer queries whereas helps to
increase accurateness and reliability of secure orders.
Customer demand keeps on changing
whereas this agile feature software adapts to changeability. It controls and
manages rush orders & make exceptions also, handles minimum time left
changes to manufacturing processes with variety of options for planning,
tracing, and action messages which are collaborative.
How is
the service provided by ERP?
Implementation cost varies with the
demand of the software product and brand also with services. Reliability is the
quality of being able to be trusted or believed because of working or behaving.
For long term benefits, during implementation of ERP both training and
education factors play vital role. Well-skilled user’s area unit economical,
extremely impelled and sometimes invent new techniques to avoid wasting time
and improvise business manners. Continuous training approach makes the service
quality better directly proportional to the betterment of product quality.
Future Recommendation
In general, the ERP system confirms
several advantages for business growth. Although the estimated value is not
exceeded after the risk is taken. Together, there seems to be an optimal level
of useful integration in ERP with margins that decrease to a certain level,
consistent with the diseconomies of scope for terribly massive implementations,
as expected. Although our data does not currently allow for a more detailed
analysis of the exact adoption model (due to the lack of detailed data on the
extent of distribution at the worker level) or the long-term impact on
productivity (due to the lack of long-term publication implementation of data
at this time), both topics are promising areas for future research. It may be a
more productive survey if the researcher himself observes from the beginning of
the implementation of an ERP to the production level with control and measurement
of the product, discovering at the same time the effectiveness between the
interdepartmental correlation.
Acknowledgement
The authors acknowledge Lord Buddha
Education Foundation (Asia Pacific University of Technology & Innovation)
for providing us the opportunity to work in this research.
Funding
Nil
Conflict of Interest
Nil
References
- Arachchi, S. M., Chong, S. C., & Madhushani, A. G. (2015). Quality Assurance and Quality Control in ERP Systems Implementation. American Scientific Research Journal for Engineering, Technology, and Sciences (ASRJETS), 70-83.
- Beheshti, H. M., & Beheshti, C. M. (2010). Improving productivity and firm performance with enterprise resource planning. Enterprise Information Systems, 445472.
- Bernroider, E. W. (2008). IT governance for enterprise resource planning supported by the Delone-McLean model of information systems successs. Information & Management, 45, 257-269.
- Blanchard, D. (2012). Supply Chain Management Best Practices. Wiley Best Practices.
- ERP Desk. (2015). 5 Disaster Recovery Strategies for Handling ERP Failure. Retrieved from TOOLBOX: https://it.toolbox.com/blogs/erpdesk/5-disaster-recoverystrategies-for-handling-erp-failure-121115
- Esteves, J., & Pastor, J. (2001, August). ENTERPRISE RESOURCE PLANNING SYSTEMS. Communications of AIS, p. 8.
- Gupta, M., & Kohli, A. (2006). Enterprise resource planning systems and its implications for operations function. International journal of production economics, 687-696.
- Hauptman, O., & Hirji, K. (1996). The influence of process concurrency on product outcomes in product development. IEEE Transactions on Engineering Management, 153-164.
- Institute for Work & Health. (2019, July 24). Cross-sectional vs. longitudinal studies | Institute for Work & Health. Retrieved from Institute for Work & Health: https://www.iwh.on.ca/what-researchers-mean-by/cross-sectional-vs-longitudinalstudies
- Joshi, V. (2017, March 24). The history of ERP systems- from the beginning to now. Retrieved from VersAccounts: http://www.versaccounts.com/blog/the-history-of-erpsystems/
- Karim, A. J. (2011). The significance of management information systems for enhancing strategic and tactical planning. JISTEM-Journal of Insformation Systems and Technology Management.
- NAM. (2011). The skills gap in U.S. manufacturing. Deloitte: NAM.
- Pagell, M., Newman, W. R., Hanna, M. D., & Krause, D. R. (2000). Uncertainty, flexibility, and buffers. Production and Inventory Management Journal, 35-43.
- Rothlin, M. (2016, April 20). An Exploratory Study of Data Quality Management Practices in the ERP Software Systems Context. Retrieved from BORIS: https://boris.unibe.ch/id/eprint/79149
- Rouse, M. (n.d.). What is longitudinal study? Retrieved July 22, 2019, from WhatIs.com: https://whatis.techtarget.com/definition/longitudinal-study
- Sakakibara, S., Flynn, B. B., Schroeder, R., & Morris, M. (1997). The impact of justin-time manufacturing and it infrastructure on manufacturing performance. Management Science, 1246-1257.
- Saunders, M., Lewis, P., & Thornhill, A. (2007). Research Methods for Business Students. Harlow: Financial Times Prentice Hall.
- Shehab, E., Sharp, M., Supramaniam, L., & Spedding, T. A. (2004). Enterprise Resource Planning: An integrative review. Business Process Management Journal, 359-386.
- Su, Y. F., & Yang, C. (2010). Why are enterprise resource planning systems indispensable to supply chain management? European Journal of Operational Research, 81-94.
- Technology Evaluation Centers. (n.d.). SAP ERP vs Microsoft Dynamics 365 ERP Comparison Report. Retrieved July 26, 2019, from Technology Evaluation Centers: https://www3.technologyevaluation.com/store/top/sap-erp-vs-microsoft-dynamics365-erp-comparison-report.html
- Thompson, J. D. (1967). Organizaitons in Action. New York: McGraw-Hill.
- VARGAS-HERNÁNDEZ, J. G., LEÓN, A. d., & VALDÉZ, A. (2011). RESEARCH METHODOLOGY STRATEGIES IN STRATEGIC MANAGEMENT. African Journal of Social Sciences, 46-72.
- Work Wise Software. (2013, November 21). How Much Does ERP Software Cost? Retrieved from WorkWISESoftware: https://www.workwisellc.com/blog/erpsoftware-cost/

This work is licensed under a Creative Commons Attribution 4.0 International License.