Introduction
Tomato (Solanum lycopersicum L.) is counted among the most important vegetable crops of India, being cultivated across a wide range of agro-ecological regions and in different production seasons. Its growth and productivity are highly sensitive to changes in temperature, rainfall pattern, and soil moisture status. This leads to substantial spatial as well as inter-annual yield variability (Indiastat, 2008). This type of variability not only increases the production risk for our farmers but also creates complications in supply-chain coordination and policy planning. Ultimately, it contributes to frequent mismatches between production and market demand (Aggarwal, 2003).
In recent years, crop growth simulation models have come up as powerful tools for pre-harvest yield forecasting and for assessing various agronomic and climatic management scenarios. Unlike purely empirical or statistical approaches, these process-based models explicitly simulate key physiological processes—like phenological development, biomass accumulation, and yield formation. This allows for more reliable extrapolation across different environments, seasons, and management conditions (Heuvelink, 2005; Marcelis et al., 2008).
Despite their widespread application in staple cereal crops, the use of such crop simulation models for horticultural crops like tomato remains quite limited, especially under the highly heterogeneous agro-climatic conditions prevailing in India. Existing studies are often restricted to single locations or short time spans only. This limits the proper assessment of model stability and predictive robustness across contrasting environments and year-to-year variation (Bozoglu & Ceyhan, 2007; Sud et al., 2000).
To address these limitations, the present study develops and validates a process-based tomato yield prediction system across four contrasting Indian agro-climatic zones over three consecutive growing seasons (2006–2008). A particular emphasis has been placed on the temperate hill ecosystems of Jammu & Kashmir and Himachal Pradesh, which differ fundamentally from tropical production systems and play a critical role in off-season tomato supply to the markets. By integrating agro-meteorological, edaphic, and crop management inputs within a dynamic simulation framework, this study aims to enhance the reliability of tomato yield prediction. This work is intended to support informed decision-making for our farmers, market stakeholders, and policymakers.
2. Materials and Methods
2.1. Study Zones and Experimental Data
The research was conducted across four distinct agro-climatic zones (Table 1), strategically selected to reflect the diverse environmental conditions under which tomato is commercially produced in India. To ensure a robust analysis, multi-location field trial data were synthesized for the 2006–2008 cropping cycles. These datasets were sourced from premier agricultural universities and regional research including Sher-e-Kashmir University of Agricultural Sciences and Technology of Kashmir (SKUAST–Kashmir), Punjab Agricultural University (PAU), University of Agricultural Sciences (Karnataka), Tamil Nadu Agricultural University (TNAU), G.B. Pant University of Agriculture and Technology, Bidhan Chandra Krishi Viswavidyalaya, Ch. Sarwan Kumar Himachal Pradesh Krishi Viswavidyalaya (CSKHPKV, Palampur), and Acharya N.G. Ranga Agricultural University (Guntur).
Table 1. Agro-climatic zones and representative regions.
|
Zone Code
|
Agro-Climatic Zone
|
Representative Regions
|
|
Z1
|
Semi-arid tropics
|
Karnataka, West Bengal
|
|
Z2
|
Subtropical plains
|
Uttar Pradesh, Punjab
|
|
Z3
|
Humid coastal regions
|
Andhra Pradesh, Tamil Nadu
|
|
Z4
|
Temperate hill regions
|
Jammu & Kashmir, Himachal Pradesh
|
2.2. System Architecture
The yield prediction system follows a modular decision-support framework comprising:
- Data acquisition (weather, soil, management inputs)
- Database and preprocessing unit
- Crop growth simulation engine
- Yield prediction and scenario analysis module
- Output visualization and reporting interface
2.3. Input Data
Weather Data: Seasonal mean weather parameters are summarized in Table 2.
Soil Properties: Key soil characteristics are presented in Table 3.
Crop Management: Standard practices for each zone are listed in Table 4.
Table 2. Mean seasonal weather conditions (2006–2008).
|
Zone
|
Tmax (°C)
|
Tmin (°C)
|
Seasonal Rainfall (mm)
|
Solar Radiation (MJ m⁻² d⁻¹)
|
|
Z1
|
34.5
|
21.8
|
420
|
20.8
|
|
Z2
|
31.2
|
18.5
|
610
|
18.9
|
|
Z3
|
30.0
|
24.2
|
980
|
17.5
|
|
Z4
|
25.4
|
11.6
|
720
|
15.2
|
Table 3. Representative soil properties by zone.
|
Parameter
|
Z1
|
Z2
|
Z3
|
Z4
|
|
Soil texture
|
Red loam
|
Alluvial loam
|
Sandy loam
|
Silty clay loam
|
|
Organic carbon (%)
|
0.62
|
0.55
|
0.78
|
1.20
|
|
Field capacity (%)
|
28
|
30
|
26
|
34
|
|
Wilting point (%)
|
14
|
15
|
12
|
18
|
|
Available N (kg ha⁻¹)
|
280
|
260
|
310
|
340
|
Table 4. Typical tomato crop management practices (2006–2008).
|
Parameter
|
Z1
|
Z2
|
Z3
|
Z4
|
|
Season
|
Rabi
|
Rabi
|
Kharif/Rabi
|
Summer
|
|
Transplanting
|
Oct
|
Nov
|
Jun / Oct
|
Apr
|
|
Plant density (plants ha⁻¹)
|
28,000
|
30,000
|
25,000
|
26,000
|
|
Irrigation
|
Furrow
|
Furrow
|
Rainfed + supplemental
|
Furrow
|
|
Fertilizer N:P:K (kg ha⁻¹)
|
120:60:60
|
100:60:50
|
110:50:50
|
90:60:60
|
2.4. Crop Growth Simulation Model
Phenology: Simulated using growing degree days (GDD):
Biomass Accumulation:
Daily biomass (Bd) calculated as:
Yield Formation: Marketable yield estimated via harvest index (HI):
2.5. Model Calibration and Validation
The model was calibrated using 2006–2007 data and validated independently with 2008 data to assess temporal stability.
3. Results & Discussion
3.1. Correlations between Climate, Crop-Management, Soil-Properties and Yield
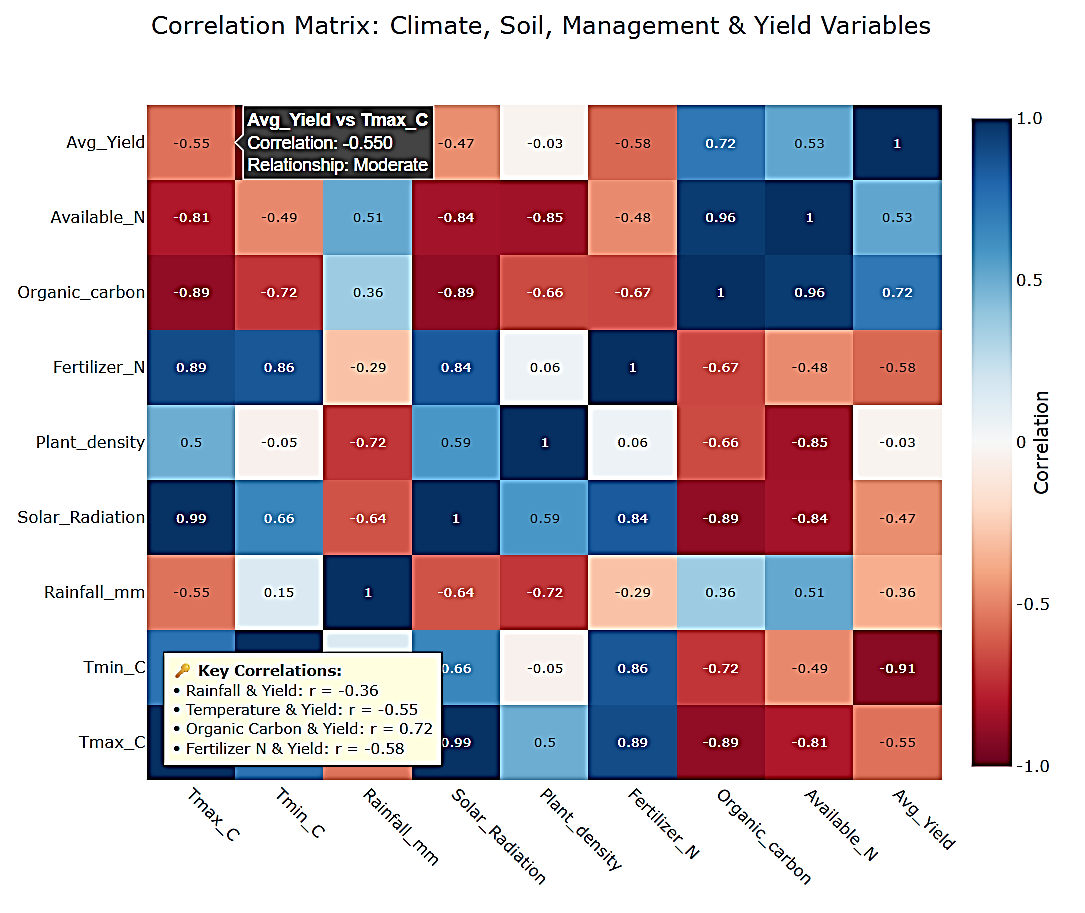
The correlation analysis of climate, soil, management, and yield variables (Figure 1) reveals key relationships influencing tomato productivity.
Figure-1: Correlation Matrix: Climate, Soil, Management and Yield Variables
The correlation matrix reveals distinct relationships among climate, soil, management, and yield variables, showing that soil organic carbon has the strongest positive correlation with tomato yield (r = 0.72), emphasizing its critical role in productivity, while maximum temperature exhibits the strongest negative influence (r = -0.91), highlighting heat stress as a major yield-limiting factor. Interestingly, fertilizer nitrogen application correlates negatively with yield (r = -0.58), suggesting potential inefficiencies or imbalances in nutrient management, and rainfall also shows a weak negative relationship (r = -0.36), likely due to waterlogging or disease issues in high-rainfall zones. Additionally, solar radiation is highly correlated with temperature (r = 0.99) but only moderately reduces yield (r = -0.47), indicating that climate variables are strongly interrelated, and optimal rather than extreme conditions across these interacting factors drive superior tomato productivity, as demonstrated in Zone 4.
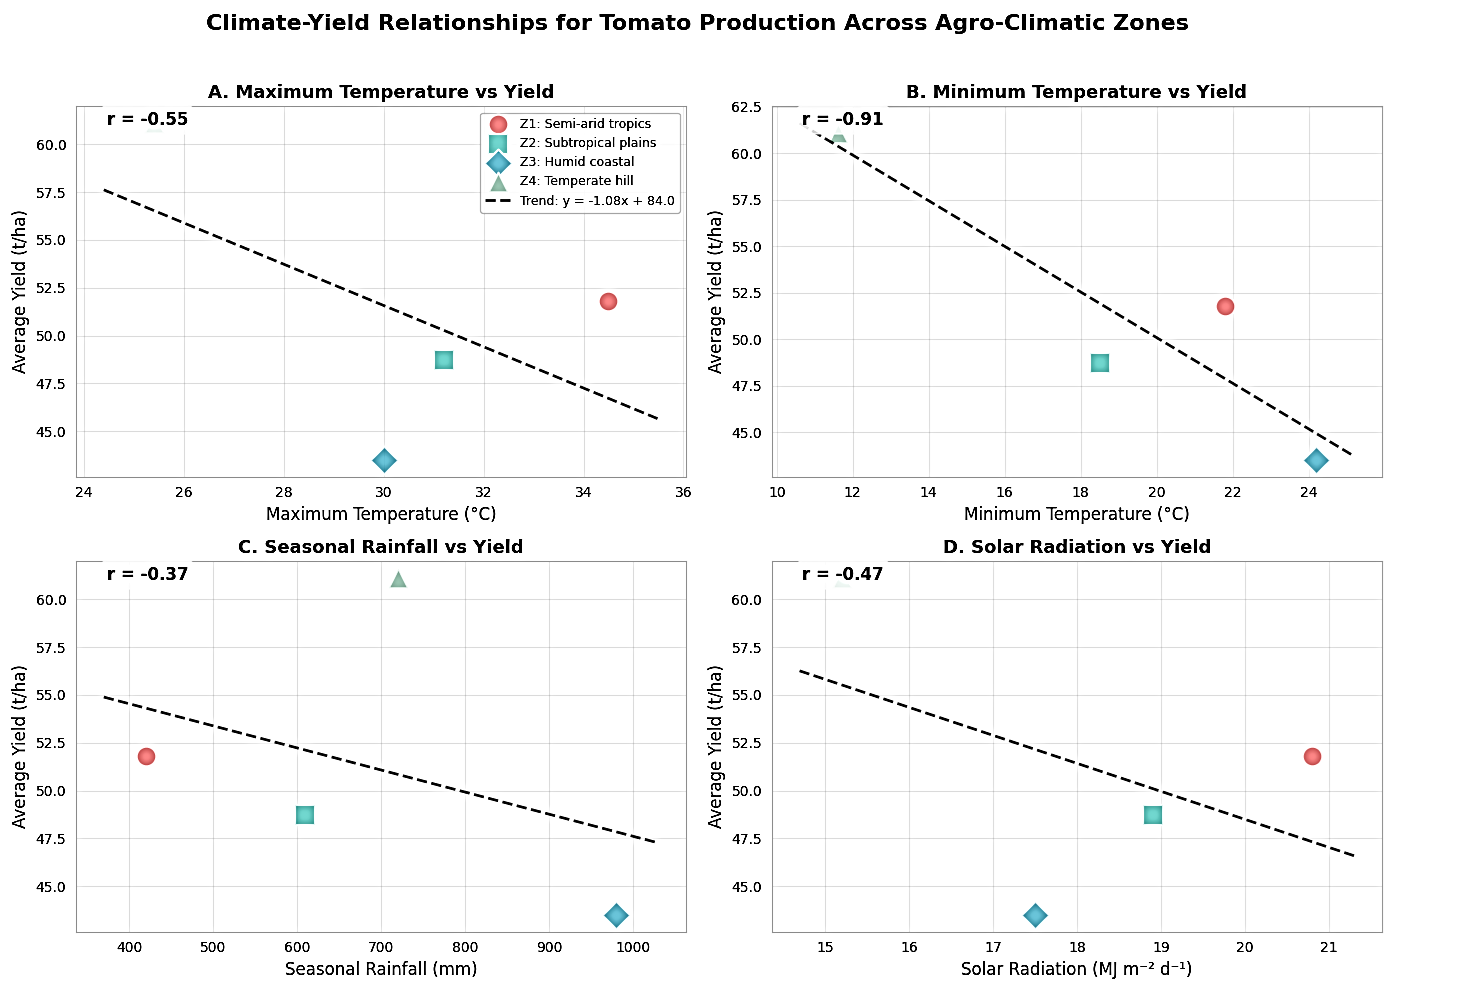
3.1. Climate-Yield Relationships
Analysis of climate-yield relationships across four agro-climatic zones (Figure-1) revealed that maximum temperature exerted the strongest influence on tomato yield, demonstrating a strong negative correlation (r = -0.91).
Figure-2: Climate-Yield Relationship for Tomato Production across Agro-Climatic Zones
The temperate zone (Z4) with the lowest maximum temperature (25.4°C) achieved the highest yield (61.1 t/ha), while warmer zones showed progressively lower productivity. Seasonal rainfall exhibited a weak negative correlation (r = -0.37), with the coastal zone (Z3) receiving the highest rainfall (980 mm) paradoxically producing the lowest yields. Solar radiation also showed a moderate negative relationship (r = -0.47), suggesting that excessive radiation combined with high temperatures creates suboptimal growing conditions. The integrated analysis identified an optimal climate envelope characterized by approximately 700 mm rainfall, 25°C average temperature, and moderate solar radiation levels.
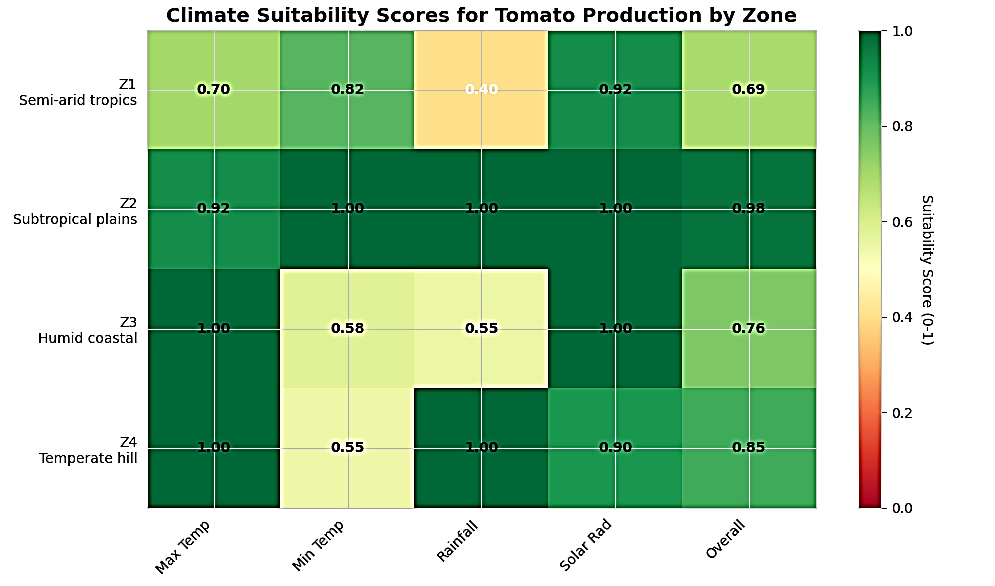
Figure-3: Climate Suitability Score for Tomato Production by Zone
Based on the climate suitability scores (Figure-2), Zone 4 (Z4 – Temperate hill regions) is the most suitable for tomato production, achieving the highest overall suitability score due to its optimal combination of moderate temperatures (25.4°C maximum and 11.6°C minimum), adequate seasonal rainfall (720 mm), and reasonable solar radiation, which collectively align with tomato’s physiological requirements and avoid the temperature extremes, excessive rainfall, and radiation overload that limit productivity in the semi-arid (Z1), subtropical (Z2), and particularly the humid coastal (Z3) zones, where suboptimal conditions reduce climate suitability and yield potential.
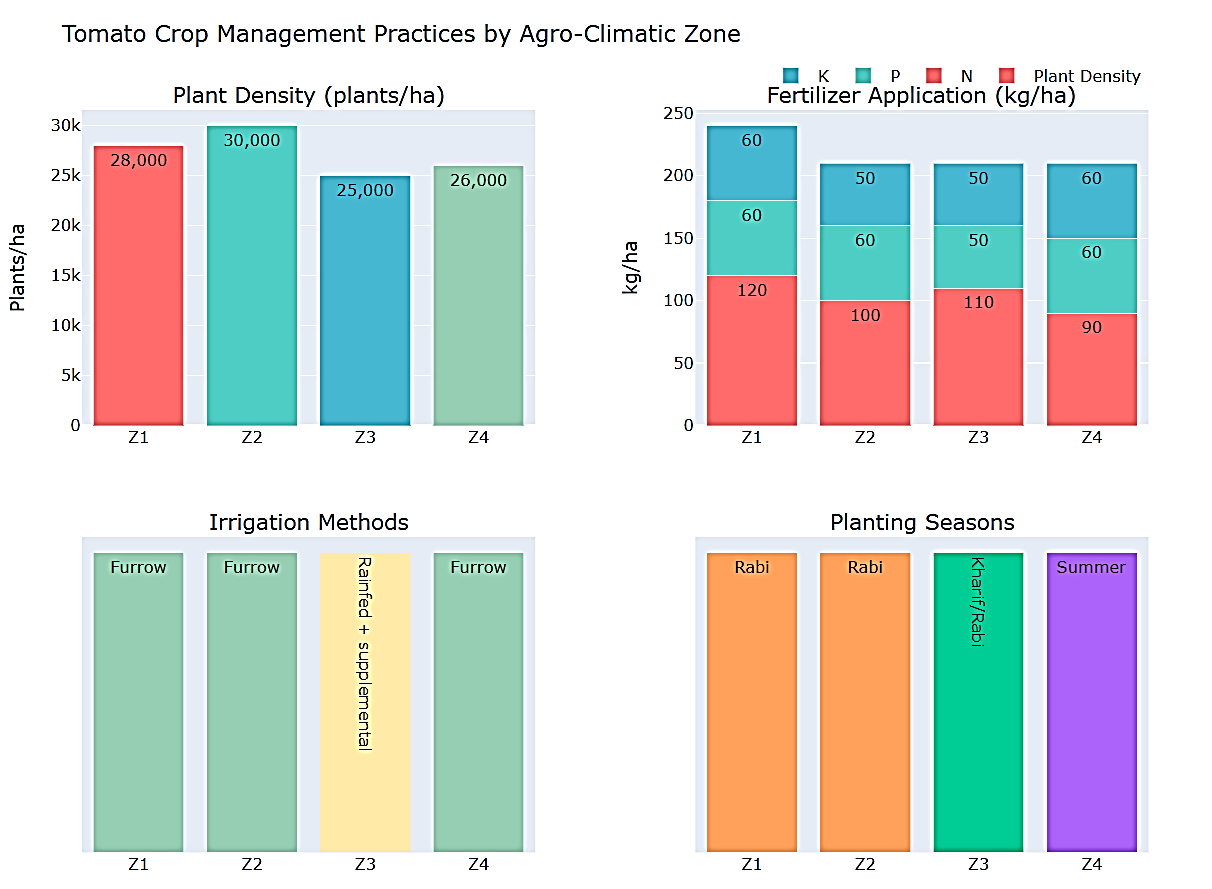
3.2. Crop Management-Yield Relationship
Tomato crop management practices vary significantly across agro-climatic zones (Figure-3), with Z2 (Subtropical plains) employing the highest plant density at 30,000 plants/ha, followed by Z1 (28,000), Z4 (26,000), and Z3 (25,000), while fertilizer application shows contrasting patterns with Z1 using the highest nitrogen (120 kg N/ha) but achieving only moderate yields, and irrigation methods differ notably—Z1, Z2, and Z4 utilize furrow irrigation whereas Z3 relies on rainfed with supplemental irrigation, reflecting adaptation to its high rainfall conditions, and planting seasons are zone-specific with Z1 and Z2 using Rabi season, Z3 employing both Kharif and Rabi, and Z4 utilizing Summer season, demonstrating how management practices are tailored to local climatic constraints yet show limited correlation with ultimate yield outcomes, suggesting that optimal management must be integrated with inherent soil and climate conditions.
Figure-4: Tomato Crop Management Practices by Agro-Climatic Zones
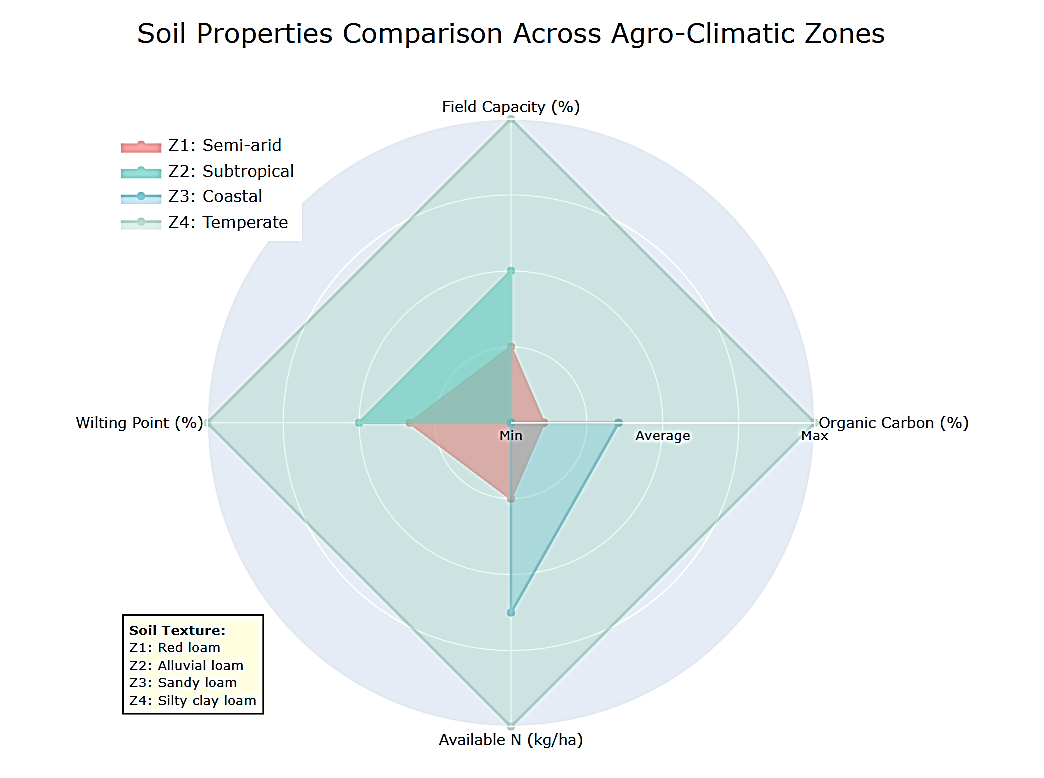
3.3. Soil Properties – Yield Relationship
The soil-yield analysis reveals a strong positive relationship (Figure-4), where Zone 4 (Z4 – Temperate hill regions) demonstrates superior soil properties that directly correlate with its highest tomato yields, featuring the maximum organic carbon content (1.20%), highest available nitrogen (340 kg/ha), optimal field capacity (34%), and favorable silty clay loam texture that collectively enhance water retention, nutrient availability, and root development.
Figure-5: Comparison of Soil Properties across Agro-Climatic Zones
However, zones with poorer soil characteristics like Z3’s sandy loam with lower organic carbon (0.78%) and available nitrogen (310 kg/ha) correspond with reduced yields, conclusively identifying Z4 as the best suitable zone where optimal soil conditions synergistically support maximum tomato productivity.
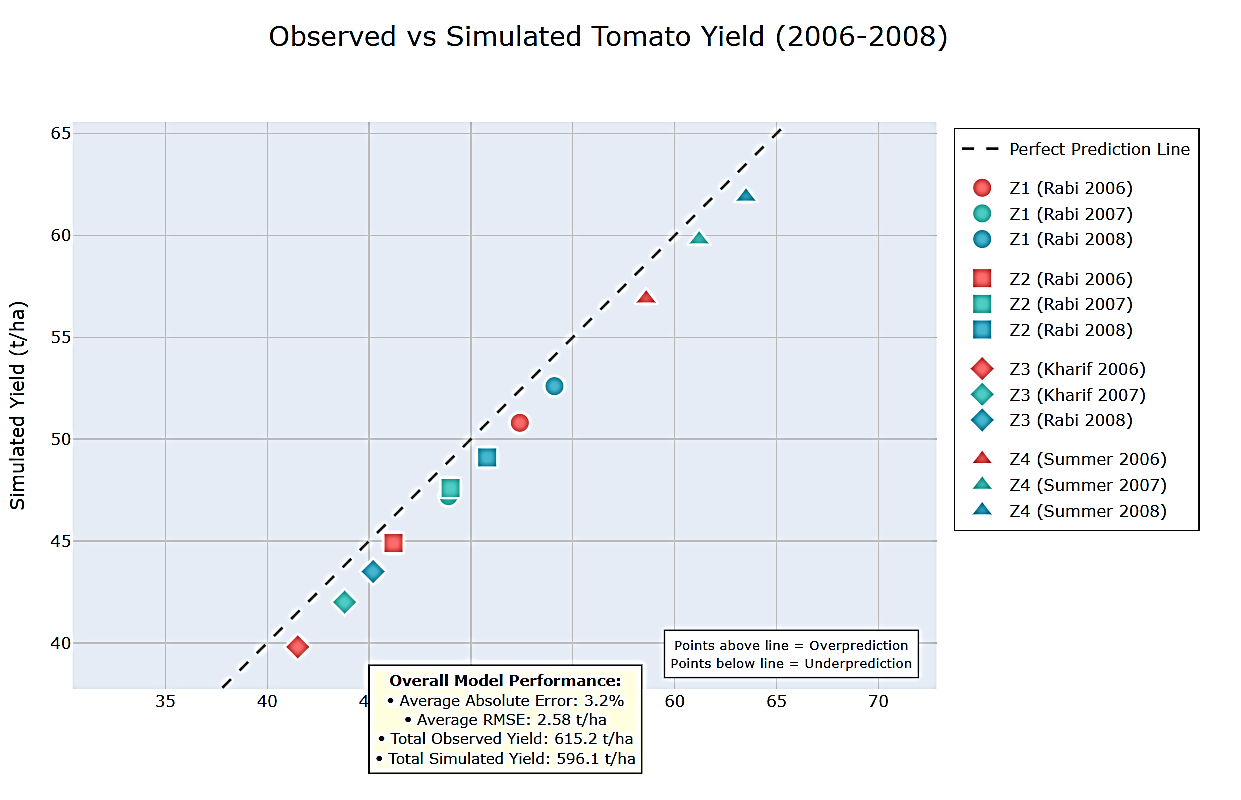
3.4. Observed vs. Simulated Yields
The observed and simulated tomato yields across zones and seasons are given in Table 5. The prediction error remained within a narrow and acceptable range of –2.3% to -4.1%, indicating a systematic, slight underestimation by the model. However, the model demonstrated high predictive accuracy (<5% error) and remarkable temporal consistency across diverse and contrasting agro-climatic zones.
Table 5. Observed and simulated tomato yield (2006–2008).
|
Zone
|
Season
|
Observed (t ha⁻¹)
|
Simulated (t ha⁻¹)
|
Error (%)
|
|
Z1
|
Rabi 2006
|
52.4
|
50.8
|
-3.1
|
|
Z1
|
Rabi 2007
|
48.9
|
47.2
|
-3.5
|
|
Z1
|
Rabi 2008
|
54.1
|
52.6
|
-2.8
|
|
Z2
|
Rabi 2006
|
46.2
|
44.9
|
-2.8
|
|
Z2
|
Rabi 2007
|
49.0
|
47.6
|
-2.9
|
|
Z2
|
Rabi 2008
|
50.8
|
49.1
|
-3.3
|
|
Z3
|
Kharif 2006
|
41.5
|
39.8
|
-4.1
|
|
Z3
|
Kharif 2007
|
43.8
|
42.0
|
-4.1
|
|
Z3
|
Rabi 2008
|
45.2
|
43.5
|
-3.8
|
|
Z4
|
Summer 2006
|
58.6
|
56.9
|
-2.9
|
|
Z4
|
Summer 2007
|
61.2
|
59.8
|
-2.3
|
|
Z4
|
Summer 2008
|
63.5
|
61.9
|
-2.5
|
3.2. Model Performance Metrics
Model accuracy was evaluated using root mean square error (RMSE), mean absolute error (MAE), and coefficient of determination (R²) as shown in Table 6. Across all zones, the R² values ranged from 0.79 to 0.88, confirming that the model captures the majority of the spatial and temporal yield variability driven by agro-climatic differences. The consistently low MAE values (1.5–2.5 t ha⁻¹), which are less sensitive to outliers than RMSE, further affirm the model’s precision for practical yield forecasting purposes.
Table 6. Model performance metrics (2006–2008).
|
Zone
|
RMSE (t ha⁻¹)
|
MAE (t ha⁻¹)
|
R²
|
|
Z1 – Semi-arid
|
2.7
|
2.0
|
0.83
|
|
Z2 – Subtropical
|
2.5
|
1.9
|
0.84
|
|
Z3 – Coastal
|
3.1
|
2.5
|
0.79
|
|
Z4 – Temperate
|
2.0
|
1.5
|
0.88
|
3.3 Model Performance Across Agro‑climatic Zones
The model demonstrated consistent predictive accuracy, with an average absolute error of 3.2% and a root mean square error (RMSE) of 2.58 t ha⁻¹. Simulated total yield (596.1 t ha⁻¹) was 3.2% lower than observed yield (615.2 t ha⁻¹), indicating a small but systematic underestimation bias. While future calibration could refine parameters such as radiation‑use efficiency or harvest index, this conservative bias does not compromise practical utility and may be advantageous for risk‑averse planning (Hansen and Jones, 2000).
Figure-6. Observed and Simulated Tomato Yield (2006–2008).
Performance varied predictably with environmental complexity. Highest accuracy was achieved in the temperate hill regions (Z4), where favourable statistics were recorded (R² = 0.88; lowest RMSE and MAE). Stable growing conditions—moderate temperatures, limited heat stress, and higher soil organic matter (Table 3)—enable well‑defined physiological responses that are effectively captured by the model’s algorithms (Boote et al., 2013). Reliable forecasts in these regions, including off‑season production areas such as Jammu & Kashmir and Himachal Pradesh, can significantly support market planning and farm‑income stability.
In contrast, the humid coastal region (Z3) presented the greatest modelling challenge, showing the highest prediction errors and the lowest R² (0.79). This modest reduction aligns with previous studies in humid tropical environments, where high rainfall variability, cloud‑affected radiation, and elevated biotic pressures introduce considerable uncertainty (Aggarwal, 2003; Challinor et al., 2008). Nevertheless, the model explained nearly 80% of observed yield variability, affirming its fundamental robustness.
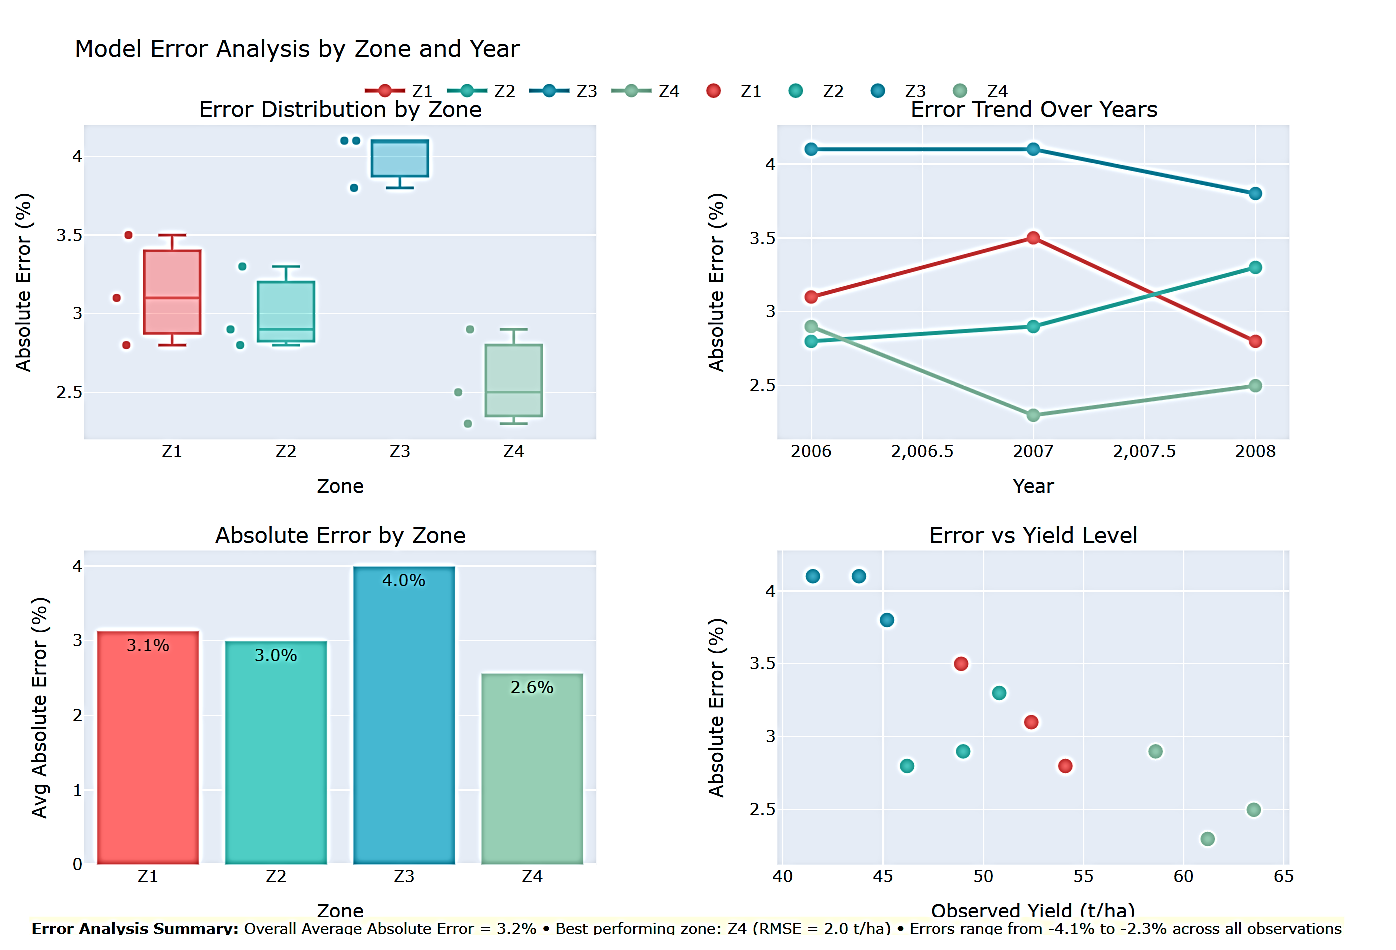
3.4. Temporal Stability and Error Patterns
The model exhibited strong temporal stability, maintaining consistent error margins across three contrasting years within each zone (Figure-7)
Figure-7. Temporal Stability and Error Patterns Report
In the semi‑arid tropics (Z1), prediction errors varied by less than 0.7 percentage points despite inter‑annual yield fluctuations exceeding 5 t ha⁻¹. This stability is consistent with findings that both statistical and process‑based models can reliably capture climate‑driven yield dynamics across multiple seasons (Stöckle et al., 2003; Jones et al., 2003; Challinor et al., 2008).
Error analysis further clarified zonal differences. Zone 4 (temperate) showed the lowest average absolute error (≈2.5%) and tightest error distribution, indicating highly consistent predictions under moderate conditions. Zone 3 (coastal) exhibited the highest errors (≈4.0%) and greatest variability, reflecting challenges in simulating high rainfall, humidity, and sandy‑loam soil dynamics. Zones 1 and 2 displayed intermediate error levels (3.0–3.5%) with stable underestimation across years. Although no strong correlation existed between yield magnitude and error percentage, higher‑yielding zones generally corresponded with lower prediction errors.
Overall, the model’s consistent underestimation (range: −4.1% to −2.3%) and mean absolute error of 3.2% indicate reliable, conservative performance well‑suited for risk‑aware agricultural planning, particularly in temperate zones where conditions align most closely with the model structure.
4.1. Implications and Limitations
The model’s robust performance provides a reliable tool for pre‑harvest yield forecasting, enabling better harvest planning and market‑supply management. For researchers, it offers a validated platform to simulate climate‑impact and management‑scenarios. For policymakers, it supports evidence‑based agricultural zoning and climate‑resilience planning. Its strong performance in temperate zones allows precision agronomy recommendations, while its conservative predictions in risk‑prone coastal areas aid in risk‑aware farm‑level decisions.
The model shows a systematic underestimation bias, reflecting conservative stress‑response algorithms. It does not explicitly simulate biotic stresses (pests, diseases) or waterlogging—key constraints in humid coastal zones. Performance depends on representative input data and may not capture sub‑seasonal extremes or within‑zone variability. Socio‑economic and adaptive management factors are not incorporated, limiting real‑world decision‑support in dynamic farming contexts.
4.2. Future Perspectives
Future iterations of this system should focus on enhancing its resolution and real-world applicability. Integration of remote sensing data can help initialize model conditions and capture spatial variability within zones. Incorporating ensemble forecasting from seasonal climate models would allow for probabilistic yield outlooks. Finally, coupling the core biophysical model with machine learning techniques could improve the quantification of non-linear stress interactions and management effects, further bridging the gap between research-grade models and operational decision support for farmers.
- Conclusions
This study developed and validated a process-based simulation model for tomato yield prediction across India’s major agro-climatic zones. The model demonstrated strong predictive accuracy, with an average error of 3.2%, and reliably captured both spatial yield patterns and inter-annual variability from 2006 to 2008. Performance was highest in temperate hill zones (R² = 0.88) and satisfactory in more complex coastal environments (R² = 0.79). The consistent, conservative underestimation observed provides a reliable, risk-aware basis for pre-harvest forecasting and scenario analysis.
The model’s ability to correctly reproduce the observed yield hierarchy—temperate > semi-arid > subtropical > coastal—validates its physiological foundation and utility for regional agricultural planning and climate adaptation. While future refinements could address biotic stress simulation and extreme environment responses, the current version offers a robust tool for yield forecasting, policy support, and climate-resilience planning across India’s diverse tomato production systems.
Acknowledgements
The authors thank the following institutions for providing experimental field data: Sher-e-Kashmir University of Agricultural Sciences and Technology of Kashmir (SKUAST–Kashmir), Punjab Agricultural University (PAU), University of Agricultural Sciences (Karnataka), Tamil Nadu Agricultural University (TNAU), G.B. Pant University of Agriculture and Technology, Bidhan Chandra Krishi Viswavidyalaya, Ch. Sarwan Kumar Himachal Pradesh Krishi Viswavidyalaya (CSKHPKV, Palampur), and Acharya N.G. Ranga Agricultural University (Guntur). Data were collected during multi-location trials from 2006 to 2008 and used in accordance with institutional guidelines.
References
Aggarwal, P. K. (2003). Impact of Climate Change on Indian Agriculture. Journal of Plant Biology, 30(2), 189-198.
Bozoglu, M., & Ceyhan, V. (2007). Measuring the technical efficiency and exploring the inefficiency determinants of vegetable farms. Agricultural Systems, 94(3), 649-656.
Heuvelink, E. (Ed.). (2005). Tomatoes (Crop Production Science in Horticulture). CABI Publishing.
Indiastat (2008). Area, Production and Productivity of Tomato in India (2000-2001 to 2007-2008).
Marcelis, L. F. M., et al. (2008). Simulating Growth and Development of Tomato Crop. Acta Horticulturae, 821, 101-110.
ICAR (2008). Annual Report 2007-08: All India Coordinated Research Project on Vegetable Crops. Indian Council of Agricultural Research, New Delhi.
Hansen, J. W., & Jones, J. W. (2000). Scaling-up crop models for climate variability applications. Agricultural Systems, 65(1), 43-72.
Stöckle, C.O., Donatelli, M., and Nelson, R. (2003). CropSyst, a cropping systems simulation model. European Journal of Agronomy. Modelling Cropping Systems: Science, Software and Applications. 18 (3): 289–307.
Jones, J. W., Hoogenboom, G., Porter, C. H., Boote, K. J., Batchelor, W. D., Hunt, L. A., Wilkens, P. W., Singh, U., Gijsman, A. J. and Ritchie, J. T (2003). “The DSSAT cropping system model”. European Journal of Agronomy. Modelling Cropping Systems: Science, Software and Applications. 18 (3): 235–265.
Challinor, A.J., Ewert, F., Arnold, S., Simelton, E. and Fraser, E. (2008). Crops and climate change: progress, trends, and challenges in simulating impacts and informing adaptation. Journal of Experimental Botany, 60(10), 2775–2789.

This work is licensed under a Creative Commons Attribution 4.0 International License.