Introduction
In packet networks the problem of congestion can be explained as when too many packets try to access the same router buffer as a result of which some amount of packets being dropped. One more definition of congestion is that when user sends data into the network at a rate higher than allowed by the networking resources. Congestion can occur when there are many clients sending packets to the same destination. It can also occur due to presence of slow processors at the router [1] and also due to low bandwidth of a particular line. There are following two approaches to control congestion:
Congestion Prevention
It is the preliminary step which focuses to keep the network neat and clean.
Congestion Control
It is the post step in which congestion has already degraded the performance of the network. In the worst case, one might need to stop the network, which is obviously not easy in normal circumstances.
To tackle the problem of congestion many Active Queue Management Algorithms have been proposed. For congestion prevention an algorithm called as Random Early Detection (RED) [2] was introduced. This was successor of drop tail mechanism in which a First in First out (FIFO) queue is maintained but its main drawback was that it suffered from the problem of global synchronization. It was pointed out by Hashem [3] that drop tail routers suffer from global synchronization which means that the congestion window size of all the connection is reduced with the same rate irrespective of connection’s share of bandwidth.
Overview of Congestion Control Algorithms
It is known that it is better to avoid congestion instead of letting it happen and degrade network performance. Sometimes the congestion hampers the network performance in such a way that one might have to stop the network, which is not feasible in actual practise. This concept leads to an idea of discarding the packets before when the router queue is full, which is known in the form of a popular algorithm called as Random Early Detection (RED).
This algorithm was introduced by Floyd and Jacobson in 1993. In Transmission Control mechanism the packet loss acts as an indication to the source to slow down by reducing its window size. It also prevents the problem of global synchronization. One of the reasons behind this concept is that TCP was exclusively designed for wired networks. It is known that the wired networks are more reliable as compared to wireless networks. Therefore packets are lost mostly due to packet loss and not due to transmission errors.
In this algorithm the packets are dropped even before the buffer is fully exhausted (hence the word “early” in its name). Routers maintain a record of the average queue length. When the average queue length exceeds a particular threshold value, the line is said to be congested at that point of time.
Random Early Detection (RED) Algorithm
The following three phases sum up the algorithm [4]
Phase 1: Normal Operation
When the average queue size is less than the minimum threshold value of the queue, in this case no packet is dropped.
Phase 2: Congestion Avoidance
When the average queue size lies between the minimum and maximum thresholds, packets are dropped with a certain probability called as pa. The probability is a function of the average queue size. It means that larger the queue size, the dropping probability will be at a higher side.
Phase 3: Congestion Control
A low-pass filter with an exponential weighted moving average (EWMA) model is used by RED routers so as to calculate average queue size. This average queue size is compared with the minimum and the maximum threshold values of the queue. When the average queue size lies between minimum and maximum threshold, each arriving packet is marked with a certain probability called as pa, where pa is a function of average queue size (avg). This probability with which the packet is marked is roughly proportional to the connection’s share of bandwidth at the router or the gateway. But when the average queue size exceeds the maximum threshold, in that case every arriving packet is marked or dropped as per the configuration.
Due to drawbacks of RED algorithm [5] like its sensitivity towards its parameters, variation in the average queue size with the level of congestion, more delay, throughput sensitivity etc. To avoid this situation requires constant tuning of the RED parameters.
Several enhancements were proposed in RED which intends to avoid the problems discussed above. However, most of these schemes represent substantial departures from the basic RED design. But ARED is one that brings out minimal change to RED and is capable of removing the problems of variable delay and parameter sensitivity as mentioned above. The original ARED proposal of Feng et al [8] from 1997 retains RED’s basic structure and merely adjusts the parameter maxp to keep the average queue size between minth and maxth.
Adaptive Random Early Detection (ARED) Algorithm
Adaptive Random Early Detection (ARED) [8] is a variant of RED and has evolved its base from RED. It is distinct with the following two main features:
It automatically sets Queue weight (Qw), Minimum Threshold (Minth) and Maximum Threshold (Maxth).
It dynamically adapts maximum drop probability (maxp).
This algorithm makes use of additional parameters which are listed as below:
Figure1: ARED Algorithm
|
PARAMETER
|
VALUE
|
|
Interval
|
It is the time interval value which is fixed as 0.5 seconds.
|
|
Target
|
Target for average queue size (avg).
[minth+ 0.4 * (maxth-minth), minth + 0.6 * (maxth– minth) ]
|
|
Α
|
Increment factor
Min(0.01, maxp/4)
|
|
Β
|
Decrement factor
It is fixed to a value of 0.9
|
Table 1: ARED Parameters
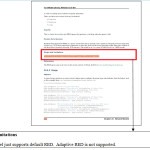
Figure 2 below shows the NS-3 Model Library tutorial as released on January 20, 2016. Its Network module discusses NS-3 support for Drop Tail, RED, but in its Scope and Limitations, it says that “RED model just supports default RED. ARED is not supported.” In this paper the ARED algorithm has been successfully implemented in NS-3.24 and a comparative study of both the algorithms has been conducted. The performance of the algorithm has been evaluated using many performance parameters as below:
Throughput
This is defined as the number of packets successfully received at the destination in per unit time.
Delay
The delay of a network specifies how long it takes for a bit of data to travel across the network from one node or endpoint to another. It is typically measured in seconds.
Packet Loss Rate
This can be defined as the number of packets lost during the transmission in per unit time.
Packet Delivery Ratio (PDR)
The ratio of packets that are successfully delivered to a destination compared to the number of packets that have been sent out by the sender.
Queue size and Average queue size
It defines the RED/ Dynamic ARED queue size and average queue size.
Jitter
It is the inter-arrival time of the packets.
Figure 2: NS-3 Library Model
Network Simulation And Implementation Scenario
To study the impact of congestion control algorithms, a network with 6 nodes has been created and results of both algorithms have been compared. These two scenarios are created with the help of NS-3 [7]. NS-3 Animator tool animates the behaviour of network in user defined conditions. Two cases implemented in simulation software are:
In first case N4 node is configured as RED router.
In second case N4 node is configured as Adaptive RED router and results are analyzed.
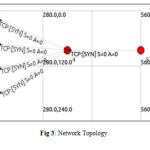
There are 4 nodes N0, N1, N2 and N3, at the left side of bolttleneck link, sending data to the same node i.e N4. This node is acting as an RED or Adaptive RED router as per configuration. As all the clients are sending data to the same node, a queue will be built up called as RED queue. The queue length and average queue length of the queue have also been analyzed. The packets are then further being transmitted to node N5 that is the final destination for packet transmission. The following figure shows the network configuration on Network Animator of NS-3.
Figure 3: Network Topology
|
S. No.
|
Link
|
Delay
|
Data Rate
|
AQM Algorithm
|
|
1
|
N0N4
|
1 ms
|
25 Mbps
|
Drop-tail
|
|
2
|
N1N4
|
1 ms
|
25 Mbps
|
Drop-tail
|
|
3
|
N2N4
|
1 ms
|
25 Mbps
|
Drop-tail
|
|
4
|
N3N4
|
1 ms
|
25 Mbps
|
Drop-tail
|
|
5
|
N4N5
|
5 ms
|
25 Mbps
|
RED/Adaptive RED
|
Fig 4: Network Configuration
Results And Performance Evaluation
To evaluate the comparative analysis of ARED and RED, NS-3.24 has been used to simulate the series of simulation scenarios.
Throughput
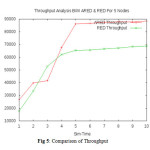
In this paper, the throughput for RED and ARED has been evaluated. The link capacity is taken as 2 Mbps. As it is known that throughput can be measured as a router-based metric of aggregate link utilization, as a flow metric of per-connection transfer times [9]. Throughput is the flow rate which is measured in bytes per second. Throughput for RED measures 68787.3 Kbps. The throughput of ARED simulation scenario measures 88542.6 Kbps.
Figure 5: Comparison of Throughput
Delay
Like throughput, delay can be measured as router-based metric of queuing delay over time, or as a flow based metric in terms of per-packet transfer time. Per packet delay can also include delay at the sender waiting for the transport protocol to send the packet [9].
Delay and jitter are also important performance parameters in real time applications in immediate routers. This study essentially concentrates on TCP packets rather than real-time applications packets such as User Datagram Protocol (UDP) [5].
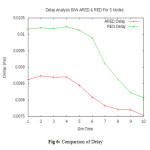
For reliable transfer, the per-packet transfer time seen by the application includes the possible delay of retransmitting a lost packet. Figure 6 shows the graph of Delay in both ARED and RED. Delay in a network is defined as how long it takes for a bit of data to travel across the network from one node to another. The delay is measured in millisecond (ms). The delay for ARED is 0.0075 ms whereas that of RED is 0.008 ms. It is known that lesser is the delay, better is the network performance.
ARED has lowest delay parameter value. Because RED has highest packet drop, as discussed afterwards, a packet that arrives to the router buffer has to be forwarded or dropped without waiting anymore in router buffer. This is reason why ARED has lowest delay.
Figure 6: Comparison of Delay
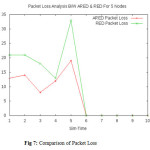
Packet Loss Ratio
It is measured as a percentage of packets lost with respect to packets sent. The various packet parameters have been shown below. It shows that ARED has less packet drop rate as compared to RED.
|
Criteria
|
RED
|
ARED
|
|
Number of packets transmitted
|
16481
|
16578
|
|
Number of packets received
|
16375
|
16512
|
|
Number of packets lost
|
106
|
66
|
|
Packet Delivery Ratio (PDR)
|
99.35 %
|
99.60 %
|
Table 2: Various parameters of RED and ARED
16375 packets were received out of 16481 packets delivered from all connections were lost during simulation time when RED was used, which resulted in 106 number of packets dropped. 16512 packets received out of 16578 during the simulation when the router buffer operates by using ARED algorithm. This resulted in 66 dropped packets.
Figure 7: Comparison of Packet Loss
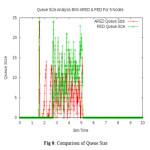
Queue Size
It is a measure of congestion in the network. Queue size is the number of packets queued into the buffer. The MODE attribute is set with a value QUEUE_MODE_PACKETS. The queue size of RED router measures 2928 whereas that with ARED measures 2089.
Figure 8: Comparison of Queue Size
Queue length distribution of ARED remains unchanged during simulation. Router buffer frequently reduces to zero in RED because RED is aggressive when traffic load is light and not aggressive when traffic load is heavy. Moreover, queue length frequently overflows in RED as couldn’t detect congestion well when a bursty traffic is encountered. RED queue frequently reduces to zero and overflows. This is the reason why RED has lost more number of data packets.
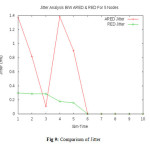
Jitter
Jitter can be defined as the variation that occurs in the delay of receiving packets. As discussed earlier that both delay and jitter are interrelated concepts, which are important parameters for real-time applications in intermediate routers. In the simulation scenario considered above, the jitter of RED comes out to be 0.00005 ms whereas that of ARED is 0.00027 ms.
Figure 9: Comparison of Jitter
Testifying Jitter Parameter
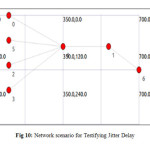
As shown above, dynamic ARED had a jitter of 0.00254 ms which is at a greater side as compared to that of RED. On further testifying jitter performance by modifying the network topology a bit, the jitter has again been evaluated. The new topology is as follows.
Figure 10: Network scenario for Testifying Jitter Delay
The topology comprises of 6 nodes with N0, N5, N2 and N3 sending packets to N1 and N1 further forwarding the packets to N6. The jitter has been computed for this network.
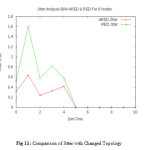
Figure 11: Comparison of Jitter with Changed Topology
An additional node has been added so to further testify the jitter. The jitter of ARED is less as compared to that of RED which is there as a result of additional node. It clearly indicates that earlier network configuration suffered from the problem of congestion and it was the presence of this congestion which hampered delay results of ARED.
Summary
This paper demonstrates the performance of ARED algorithm in comparison to its predecessor RED. The comparison has been carried out using NS-3 simulator. The result clearly indicates that the additional parameters used in ARED helps in enhancing its performance. Many performance parameters helps to evaluate the performance which includes throughput, delay, Packet Delivery Ratio (PDR), queue size, packet loss ratio and jitter. The jitter parameter has been further testified by addition of another node, which clearly indicates that the network topology is also responsible for determining the network bandwidth in terms of all the performance parameters discussed.
References
- Tanenbaum A S (2003) Computer Networks.Pp 384-86.Practice-Hall, Upper Saddle River, New Jersey, U.S.A.
- Floyd S and Jacobson V (1993) Random early detection gateways for congestion avoidance.IEEE/ACM Transactions on Networking1: 397-413.
CrossRef
- Hashem E, “Analysis of random drop for gateway congestion control”, Report LCS TR-465, Laboratoryfor Computer Science, MIT,Cambridge, MA,1989, pp:103.
- Qadeer M A, Sharma V, Agarwal A and Husain S S ,“Differentiated Services with Multiple Random Early Detection Algorithm using ns2 Simulator” in IEEE ICC 2009 proc, 2009,© IEEE
- Abbasov B and Korukoglu S (2008) Effective RED: An algorithm to improve RED’s performance by reducing packet loss rate. J NetwComputAppl 32: 703-09.
CrossRef
- http://en.wikipedia.org/wiki/Random_early_detection
- https://www.nsnam.org/docs/tutorial/ns-3-tutorial.pdf
- Gummandi R(2001) Dynamic ARED: An Algorithm for Increasing the Robustness of RED’s Active Queue Management, manuscript under submission.
- Floyd S (2008), Metrics for the Evaluation of Congestion Control Mechanisms [Memorandum] Network Working Group.

This work is licensed under a Creative Commons Attribution 4.0 International License.