Introduction
The UK retail sector covered all businesses that sold goods to the public i.e. large chains, department stores, independent stores, virtual stores. The UK retail sector was a leader in innovation. Various retail formats were Hypermarkets & Supermarkets, Small super-stores, Convenience stores, Discounters, Departmental stores/local stores/specialty stores and online. E-commerce and self-service were reshaping the shopping experience across the world and had put UK at the vanguard of multi-channel shopping. UK retail accounted for 11%of global internet retail sales and UK had the highest spend per head for e-commerce of any country(Govt.uk- UK Trade & Investment). 11% of all VAT-registered businesses in the UK were retailers, with the current total of 180,875 retailers. Retail sales accounted for 1/5 of the UK’s economy, and generate almost 8% of the UK’s Gross Domestic Product (GDP). The UK retail market was set to increase in size by 15% over the next five years, taking its value to just over £312bn. The 4 biggest chains in the UK were Tesco, ASDA, Sainsbury, and Morrison’s, and they accounted for 67.9% of the grocery market. Tesco had 28% market share, followed by ASDA (15.2%), Sainsbury’s (14.3%) and Morrison’s (10.4%). Other UK supermarket chains included Waitrose, M&S, Iceland, and so on (Nielsen Homescan). For the grocery market, private label had already occupied around 55% market share in 2008 (Nielsen’s research).
Britain’s high street has faced several problems in past few months like high vacancy rates, parking problems, high rents, and impact of recession which called for protection of high street as it was considered as a symbol of Britain’s great culture.
Customers shopping trend had been changing towards online mode due to convenience and time savings. Consumers also believed that shopping out of town lead to long driving time, extra purchases and waste of fuel. Same could also be stated with recent decrease in share of supermarket giants like Tesco & Sainsbury. Keeping this in view present study was an attempt to analyse various factors causing decline in share of supermarkets and preference of customer over other retail formats like high streets and online markets.
Objectives of the Study
1. Sentiment analysis of retail sections including supermarket, high street shops and online shopping in UK
2. Micro analysis of different retail sections including factors affecting different sentiments
3. Developing Perceptual mapping for studied sections of retail and Porter’s 5 forces model
Methodology
Study Area
United Kingdom was the area of research. Online Editorial media and Google search of United Kingdom was taken for study.
Data Collection
It included secondary data from online editorial media (articles, news, research papers, research reports etc.) being published in UK about retail. Google search about retail in UK was also included in this study.
Sample Size
600 (100%) articles (articles, news, research papers, research reports etc.) were being taken from different editorial online media on major segments of retail namely High street retail (unorganised retail), Supermarkets (organised retail) and online retail.
Articles were selected for 6 months from June 2014 to June 2014 articles including major highlights and major information about retail in UK.
200 (33.33%) articles were taken for High street retail, 200 (33.33%) for Supermarkets and 200 (33.33%) for Online retail.
Analytical Technique
Sentiment analysis was used and all articles were categorized in 3 categories i.e. positive, negative and neutral.
Porter’s 5 Force model was used to describe situation of major section of retail i.e. High street retail and market forces working over it. Perceptual mapping was done for factors affecting different sentiments
Findings & Analysis
Objective1: Sentiment analysis of retail sections including supermarket, high street shops and online shopping in UK
Table1: Frequency analysis for High street market
|
High street
|
|
Response type
|
Frequency
|
Percent
|
|
Positive
|
82
|
41.0
|
|
Neutral
|
63
|
31.5
|
|
Negative
|
55
|
27.5
|
|
Total
|
200
|
100.0
|
Source: Author’s own computation from collected data 2014
High street market: Analysis showed that out of 200 sample of high street market, positive trends were on higher side, i.e. about 41 % of the total responses showed a convinced edge towards high street market. Savvy shopping techniques and usage of coupons for shopping was trending among customers and causing positive shift for their outing towards high street market. With the advancement in technology, various high street players were advancing themselves towards this change and reflecting stiff convictions, while there were some negative trends also found regarding high street market some of them were related with cause of inflation and low investment by investors in high street reason being in 2014 there was dramatic increase in level of investment into the shopping centre and out of town sectors, which was also proved by Savills research. However, remaining responses about 31.5% were categorically reported as neutral.
Table2: Frequency analysis of Shopping malls
|
Shopping malls
|
|
Response type
|
Frequency
|
Percent
|
|
Positive
|
12
|
6.0
|
|
Neutral
|
28
|
14.0
|
|
Negative
|
160
|
80.0
|
|
Total
|
200
|
100.0
|
Source: Author’s own computation from collected data 2014
Shopping malls: Shopping centres represent a substantial slice of the UK economy and have rightly attracted considerable research. Analysis of same had also been done and findings have shown that major responses were found to be negative for this retail section, which was about 80%. Studies had shown that second quarter of 2014 saw a decline in rental growth of 0.3% year-on-year, the sixth consecutive year of negative growth. At 5.60%, the shopping centre transactional yield in Q2 had fallen below the all property average (6.06%) for the first time since 2010(Lsh.co.uk). It is therefore, getting more expensive for investors to access the shopping centre market. However, neutral responses were found to be about 14% while remaining 6% of responses were found to be positive.
Table3: Frequency analysis for online shopping
|
Online Shopping
|
|
Response type
|
Frequency
|
Percent
|
|
Positive
|
80
|
40.0
|
|
Neutral
|
112
|
56.0
|
|
Negative
|
8
|
4.0
|
|
Total
|
200
|
100.0
|
Source: Author’s own computation from collected data 2014
Online Shopping
UK had one of the most developed online retail markets in the world. So, this part constituted an important segment for retail sector. Analysis for online retail segment had also been done and responses are expressed in Table 3.Online shopping undoubtedly, had comparative edge over high street and other retail market segments. Convenience, better value for money and access to a greater product range helped online market to grow better than high street, and analysis in table 3 showed that there was very low frequency for the negative responses for the online retail segment. However, positive trend were observed to be about 40%, in addition to this majority of the responses in case of online shopping have shown neutral status which was about 56%.
Objective: 2 Micro-analysis of different retail sections including factors affecting different sentiments
High Street Retail Micro Analysis
Table 4: An overview of High Street Retail
|
PARAMEMTERS
|
CONTRIBUTION
|
|
Retail spending on High Streets
|
39.8%
|
|
Growth% decline as compared to 2013
|
-2.4%
|
|
Town Centre Sales
|
39.8%
|
|
Out of Town Sales
|
32.3%
|
|
Neighborhood Sales
|
15.7%
|
|
Non-Store Sales
|
12.2%
|
(Source: http://www.parliament.uk/briefing-papers/sn06186.pdf.)
Table 5: TOP 10 HIGH STREET CENTRES
|
HDH Vitality Ranking
|
Retail Centre
|
HDH Vitality Score (0-400)
|
HDH Retail Spend Potential
|
|
1
|
Westfield London
|
312
|
€2,26,55,28,498
|
|
2
|
Chelsea
|
290
|
€ 79,52,83,829
|
|
3
|
Knightsbridge
|
261
|
€ 67,52,70,025
|
|
4
|
Canary Wharf
|
254
|
€ 56,33,90,481
|
|
5
|
Brent Cross
|
246
|
€ 1,50,12,94,061
|
|
6
|
Richmond
|
244
|
€ 41,31,87,352
|
|
7
|
Cambridge
|
240
|
€ 1,46,52,36,495
|
|
8
|
Bluewater
|
236
|
€ 1,96,05,72,594
|
|
9
|
Kensington
|
208
|
€ 70,19,30,527
|
|
10
|
Bath
|
208
|
€ 1289255124
|
Table 6: BOTTOM 10 HIGH STREET CENTRES
|
HDH Vitality Ranking
|
Retail Centre
|
HDH Vitality Score (0-400)
|
HDH Retail Spend Potential
|
|
1
|
Aldershot
|
21
|
€ 40,16,55,127
|
|
2
|
Folkestone
|
21
|
€ 36,30,01,712
|
|
3
|
Ramsgate
|
19
|
€ 22,73,02,963
|
|
4
|
Brighton-London Road
|
17
|
€ 12,36,46,799
|
|
5
|
Dover
|
13
|
€ 25,76,66,949
|
|
6
|
Paingnton
|
29
|
€ 21,92,75,655
|
|
7
|
St. Austell
|
27
|
€ 26,47,34,450
|
|
8
|
Bournemouth- Boscombe
|
24
|
€ 28,64,40,248
|
|
9
|
Straud
|
19
|
€ 20,43,16,802
|
|
10
|
Bristol – Bedminster
|
16
|
€ 12,06,88,611
|
Table 4, 5 and 6 talked about contribution of different sections of high streets along with top 10 and bottom 10 high streets for UK.Britain’s high streets had been transformed in the last 10 years due to change in shopping pattern, fashion and other trends. Compared to 2013, there was reduction in sales in 2014 by 2.4% for high streets. High street retail formed 39.8% share in UK retail sector. High streets were facing problems like limited parking space, high maintenance cost of shops including rents and insurance. Vigorous price war was initiated between supermarkets, high street shops and online retail shops. Centre vacancy rate of high street shops was 10.3% in October and in July’s rate was 10.1%. Footfall on high streets also fell by 1.4% with a rise of 1.9% for out-of-town shopping centres. Overall, retail footfall was down by 0.8%. Four regions in England reported footfall above the UK average namely East Midlands up by 2%, South-East up by 1.5%, East up by 0.8% and North & Yorkshire up by 0.5%.Northern Ireland reported the largest decline in footfall rate, down by 5.3% in October.
Table 7: FACTORS AFFECTING HIGH STREET GROWTH
|
High street * Factors High street Cross tabulation
|
|
Count
|
|
|
Factors High street
|
Total
|
|
Preference over malls
|
High rents of shops
|
Protection by local citizens
|
High street vacancy rate
|
New trends on high street
|
|
High street
|
Positive
|
16
|
16
|
16
|
18
|
16
|
82
|
|
Neutral
|
12
|
13
|
13
|
12
|
13
|
63
|
|
Negative
|
12
|
11
|
11
|
10
|
11
|
55
|
|
Total
|
40
|
40
|
40
|
40
|
40
|
200
|
Factor “High street vacancy rate” gained highest positive sentiment. Media and local citizens talked positive about high street and were hopeful that high vacancy rate would go down in coming months due to new trends and decline in mall culture.
The factor “Preference over malls” had highest negative articles as local retailers of high street did not support mall culture and thus citizens of UK were also reducing their preference to do shopping in malls.
High Street had undergone lot of problems like impact of recession leading to high rent of shops, closure of shops (high vacancy rate) and customers being taken over by shopping malls due to impact of American culture.
At the same time, being a symbol of British culture and tradition, High Street was being protected by local citizens performing public support rallies and press coverage about supporting high street shops for making purchases. Some new trends made their existence at high street leading to increased sales & footfall like Tattoo Parlours increased sales by 173%, fast food stores & take aways by 54% and convenience stores increased by 186 %. Out-dated trends were photo-printing shops (70% decrease), phone shops, video stores like blockbuster (98% drop in TV and DVD purchases) in last 10 year.
Supermarket Retail Micro Analysis
Table 8: INDUSTRY OVERVIEW
|
INDUSTRY STATISTICS
|
MARKET SIZE
|
|
Revenue
|
€164 Billion
|
|
Annual Growth Rate (2010-15)
|
2.5%
|
|
Employment
|
980,997
|
|
Businesses
|
61
|
Table 9: MAJOR SUPERMARKET RETAIL GIANTS
|
RETAIL GIANTS
|
MARKET SHARE
|
|
Asda
|
15.2%
|
|
Sainsbury’s
|
14.5%
|
|
Tesco
|
11.1%
|
|
WM Morrisons
|
10.4%
|
Table 8 & 9 had shown that supermarket retail had been a big source of revenue generation, Asda & Sainsbury’s, Tesco and Morrisons were the market leaders. However in past few months supermarket giants like Tesco & Sainsbury’s dipped with decline in shares due to change in consumer preferences and buying behaviour. Four major supermarkets prepared a strategy to overcome the price war with Aldi Lidl through predatory pricing and high discounts for FMGC items like soaps, toothpaste. Shampoo etc. Although supermarkets had been successful, but people now preferred to shop online or over high street due to convenience and time savings. Consumers also believed that shopping at malls lead to long driving time, extra purchases and waste of fuel.
Table 10: FACTORS AFFECTING SUPERMARKET RETAIL GROWTH
|
Shopping malls * Factors Supermarket retail Cross tabulation
|
|
Count
|
|
|
Factors Shopping malls
|
Total
|
|
Increase in stake of malls by big brands
|
Malls matched price of discounted stores
|
Protest by local retailers
|
Impact of Ebola
|
Walmart stopped health benefits for part-time workers
|
|
Shopping malls
|
Positive
|
4
|
2
|
1
|
3
|
2
|
12
|
|
Neutral
|
9
|
3
|
8
|
3
|
5
|
28
|
|
Negative
|
27
|
35
|
31
|
34
|
33
|
160
|
|
Total
|
40
|
40
|
40
|
40
|
40
|
200
|
Factor “Increase in stake of malls by big brands” had highest number of negative articles due to discount stores like Aldi Lidl which offered purchases at low prices thus cutting the share of other shopping malls. Other reasons for negative articles were due to removal of health benefits by Walmart, protest by local citizens and retailers against mall culture to protect high street retail.
Supermarket retail had very less positive and neutral articles due to strong opposition by local retailers of UK, impact of Ebola virus which terrified people of going out for shopping and increased interest of consumers in online shopping.
Online Retail Micro Analysis
Table 11: INDUSTRY OVERVIEW
|
ONLINE SALES
|
MARKET SHARE (bn €)
|
GROWTH
|
|
UK-Total Sales
|
€ 44.97
|
15.8%
|
|
Europe – Total Sales
|
€ 111.21
|
21.1%
|
|
Mobile shopping sales UK
|
€ 19.78
|
62%
|
|
Tablet shopping sales UK
|
€ 3.20
|
100%
|
Mobile shopping witnessed highest growth amongst all forms of retail. High street shops and Supermarkets were trying to strengthen their online retail and to make their products available online for increased sales. Due to convenience in shopping, availability of wide variety and time savings, online retail registered a growth of 15.8% in year 2014 as compared to 2013. Mobile shopping and tablet shopping created a revolution in retail industry and increased the percentage of purchases made by several folds. Easy surfing and paying option made mobile shopping an enjoyable experience for the customers.
Table 12: FACTORS AFFECTING ONLINE RETAIL GROWTH
|
Online shopping * Factors Online shopping Cross tabulation
|
|
Count
|
|
|
Factors Online shopping
|
Total
|
|
Growth of mobile shopping
|
Ease in buying & high variety available
|
Home delivery
|
Saves fuel & time
|
Less foot-fall in conventional markets
|
|
Online shopping
|
Positive
|
18
|
13
|
16
|
17
|
16
|
80
|
|
Neutral
|
21
|
25
|
23
|
21
|
22
|
112
|
|
Negative
|
1
|
2
|
1
|
2
|
2
|
8
|
|
Total
|
40
|
40
|
40
|
40
|
40
|
200
|
Factors “Growth of mobile shopping” and “Saves fuel & time” had maximum positive articles due to change in consumer preferences and shopping habits like checking out new fashions trends including clothes and accessories on phone and buying it online which would save fuel and time as well.
Factors “Ease in buying & high variety available” and “Home delivery” had maximum number of neutral articles as they were considered as the guaranteed benefits of online shopping.
Online shopping had very less negative articles which were about online shopping as a threat to high street shops and supermarkets due to constantly increasing purchases at online shopping leading to decreased sales at high street shops and supermarkets. Fear of scams by online shopping websites raised question over web security authorities and also raised a need for auditing online shops.
Objective: 3 Developing Perceptual mapping for studied sections of retail and Porter’s 5 forces model for high street retail
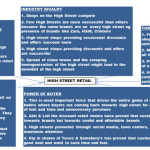
Porters 5 Forces Model
Various forces were acting upon high street retail but power of buyer was most important force. Buyers decided rise or fall of any retail section. In present times online retail was the favourite and most preverred retail section of buyers which was affecting sales of high street retail negatively. However some proactive high street retailers made their online websites to avail their products online for customers. Supermarkets also attracted the customers of high street but due to lot of protest by local retailers, supermarkets registered decrease in footfall in previous few months.
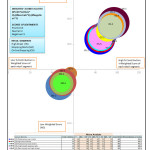
Perceptual Mapping For Retail Sections
Perceptual mapping was done between weighted score of sentiments and percentage contribution of weighted score in retail segment to identify the performance of each retail segment factor on the bench marks of sentiments and number of articles. It was found that factors of online retail section scored highest, mobile shopping, ease in buying and home delivery were top scored factors. High street retail factors like high street vaccancy rate, new trends on high street and protection by local citizens also got good weighted scored due to high number of positive articles. Factors of supermarket retail got low weighted score due to more negative articles are compared to other retail segments.
Conclusion and Recommendations
Study of 3 different retail markets of UK viz supermarket, high street shops and online shopping had been done and it could be summarized that online shopping segment was getting preference over others. Sentiments study for these retail sections had been done in detail. For high street market responses had shown that highest frequency of positive responses of 41%, while negative and neutral responses were found to be 27.5 and 31.5% respectively. With the advancement in technology, various high street players were advancing themselves towards this change and reflecting stiff convictions, this way some players had been able to sustain themselves in market and were going good. Due to protest by local retailers and citizens most of the responses found in case of shopping malls were negative i.e. 80%. In study of online shopping, maximum number of responses was found to be neutral. Further microanalysis of all three segments was carried out with five different sub-factors under each retail section. Microanalysis study for high street segment had shown that High street had undergone lots of problems like impact of recession leading to high rents of shops, closure of shops (high vacancy rate) and customers being taken over by Shopping Malls due to impact of American culture. Further it was concluded that people now preferred to shop online or over high street due to convenience and time savings. In case of shopping malls consumers believed that shopping out of town lead to long driving time, extra purchases and waste of fuel. Removal of health benefits by Walmart, lot of protest by local citizens and retailers against mall culture to protect high street retail were some of the factors identified for the bottlenecks (negative responses) of Shopping malls. Undoubtly, trend of online shopping was increasing and due to advantages to customers like convenience, better value for money and access to a greater product range than the High Street. But High street retailers now accounted for over half of the online retail market in the UK. One key factor in this growth had been driven by high street retailers to boost their online operations, and the realization that an online operation and a store network could complement each other. Hence it could be said that multi- channel retailers would have the advantage to meet the real demand and to withstand themselves in the market. Created perceptual map indicated that online mobile shopping having higher weighted score had maximum contribution of towards the growth of online retail segment.
References
- The Daily Telegraph, 8 January, p. B1.
- Evans-Pritchard, A. (2015) “It’s time you were competitive like Britain, Osborne tells European elite”, Daily Telegraph, 24 Jan, p.39.
- ONS (2013) Consumer Trends Q2 2014, London: Office for National Statistics.
- ONS (2014) Retail Sales, November 2014. London: Office for National Statistics.
- Reuters (2014a) ‘Brent holds steady above $107; focus on Ukraine, US stockpiles’, Reuters, 22 July,

This work is licensed under a Creative Commons Attribution 4.0 International License.