Segmentation of Activated Sludge Filaments using Phase Contrast Microscopic Images
Yuen Hang Ho1, Humaira Nisar* 1 and Muhammad Burhan Khan2
1Department of Electronic Engineering, Faculty of Engineering and Green Technology, Universiti Tunku Abdul Rahman, 31900 Kampar, Malaysia
2Department of Electrical Engineering, National University of Computer and Emerging Sciences, Shah Latif Town 75030, National Highway (N-5), Karachi, Pakistan
corresponding author email: humaira@utar.edu.my
DOI : http://dx.doi.org/10.13005/ojcst11.03.03
Article Publishing History
Article Received on : 04-06-2018
Article Accepted on : 23-7-2018
Article Published : 23 Jul 2018
Article Metrics
ABSTRACT:
Segmentation algorithms play an important role in image processing and analysis. The identification of objects and process monitoring strongly depends on the accuracy of the segmentation algorithms. Waste water treatment plants are used to treat wastewater from municipal and industrial plants. Activated sludge process is used in wastewater treatment plants to biodegrade the organic constituents present in waste water. This biodegradation is done with the help of microorganisms and bacteria. There are two important types of microscopic organisms present in the activated sludge plants, named as flocs as filaments, which are visible under microscope. In this paper we study the microscopic images of wastewater using phase contrast microscopy. The images are acquired from wastewater sample using a microscope. The samples of wastewater are collected from domestic wastewater treatment plant aeration tank. Our main aim is to segment threadlike organisms knows as filaments. Several segmentation algorithms (such as edge based algorithm, k-means algorithm, texture based algorithm, and watershed algorithm) will be explored and their performance will be compared using gold approximations of the images. The performance of the algorithms are evaluated using different performance metrics, such as Rand Index, specificity, variation of information, and accuracy. We have found that edge based segmentation works well for phase contrast microscopic images of activated sludge wastewater.
KEYWORDS:
Activated sludge process; Gold approximation; Microscopic image segmentation; Phase contrast; Wastewater traetment flocs and Filaments
Copy the following to cite this article:
Ho. Y. H, Nisar H, Khan M. B. Segmentation of Activated Sludge Filaments using Phase Contrast Microscopic Images. Orient.J. Comp. Sci. and Technol;11(3)
|
Copy the following to cite this URL:
Ho. Y. H, Nisar H, Khan M. B. Segmentation of Activated Sludge Filaments using Phase Contrast Microscopic Images. Orient. J. Comp. Sci. and Technol;11(3). Available from: http://www.computerscijournal.org/?p=8894
|
Introduction
Wastewater treatment plants are commonly used in developed cities worldwide for purification of wastewater. One of the methods to purify water in the wastewater treatment plants is through the activated sludge process. For the normal operational requirements of the activated sludge process, it is necessary that the sludge in the wastewater settles properly. Under abnormal conditions the sludge cannot settle and the performance of the plant is affected. The sludge consists of two types of micro organisms known as flocs and filaments that are very important for the activated sludge process. Under different operating conditions of the plant the flocs and filaments morphological properties and quantity changes. Hence microscopic image processing and analysis methods present potential solutions for monitoring the activated sludge system which is traditionally monitored using physico-chemical methods.
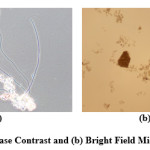
Phase contrast microscopic images are widely used for examining biological specimens. It is an optical technique in which contrast is enhanced to produce high-contrast images of microorganisms etc. This method translates very small variations in phase into corresponding changes in amplitude, which can be visualized as differences in the image contrast. In case of bright field microscopy it is difficult to observe an unstained biological specimen because the microorganisms such as filaments that have a very thin structure are not clearly visible as the contrast is very low. The Figure 1 shows the phase contrast and bright field microscopic images.
Many algorithms have been proposed in the literature for the automated segmentation of phase contrast images1-4 for cells and bio-organisms in the fields of biomedicine and biology. However, it is known that the automated segmentation and analysis of phase contrast images is a challenging task due to the low contrast between foreground objects and the background as well as various imaging artefacts present. To perform image segmentation the first step is image acquisition, followed by image pre-processing. In image segmentation, the image is divided into mutually exclusive regions which can be later identified as separate objects or regions of interest. The segmented image can be divided into foreground and background region, depending on the convention used normally the foreground represents object of interest separated from the background of the image which is not useful for a particular application. Final step in image segmentation is the performance evaluation followed by image analysis, in which the automatically segmented image is compared objectively or subjectively with the reference image. Here the main purpose of segmentation is to observe the objects that are invisible to the naked eyes and to recognise the objects in an image (flocs or filaments in the sample).5-6 The flocs are bigger in size as compared to the filaments and can be observed at 4 times magnification however filaments need at least 10 or 20 times magnification. It is also observed from Figure 1 that flocs are visible to the naked eye in both phase contrast and bright field images, however filaments are visible only in the phase contrast images.
Different algorithms have been proposed in the literature to segment phase contrast images. Supervised segmentation algorithms can produce good results, when used for more complex segmentation tasks differentiating between two types of foregrounds having the same visual attributes. Using Basic Image Features to compute each pixel will speed up the computation and decrease the computational complexity of the offline phase (such as classifier training). The fast processing time which is less than 4 seconds per 1280 x 960 pixel images is suitable for interactive segmentation applications and batch processing of experimental data. However, an extra post-processing step is needed, hence the random forest classifier is used to learn how to correct halo artifacts around foreground (objects) as background pixels without being explicitly designed to do so1
Hang Su et al. proposed a cell segmentation algorithm using semi-supervised classification technique. They used over phase retardation features.2 The proposed algorithm produces good results. The discrimination-oriented sparse representation routine reduces the time taken for the routine due to an iterative basis selection step which is based on the residual error feedback. The semi-supervised classification based on phase-homogenous atoms reduces the computational cost. The classification does not consider the eigenvalue analysis for unsupervised spectral clustering compared. In this paper the main objective is to segment the activated sludge images using phase contrast microscopy. In3 Burhan et. Al have proposed a robust phase-congruency-based method. This method is complemented by using top-hat and bottom-hat fillteringfor the segmentation of filaments Different performance metrics are used for segmentation assessment. In,4 Jaccard et. Al, have proposed a segmentation method based on image features local histograms. Later Random decision trees are used for classification.
The rest of the paper is organized as follows. In section 2 the methodology of the paper will be discussed. It will be followed by the results and their discussion. Finally the paper will be concluded followed by references.
Methodology
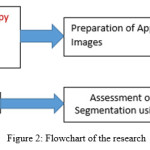
Figure 2 shows the flowchart of the proposed research. In the first step phase contrast microscopic images are acquired from samples of wastewater collected from the aeration tank of waste water treatment plants. After the images are acquired ground truth or gold images are manually prepared for performance assessment. Different traditional segmentation methods have been developed and reviewed to observe their performance. Finally performance assessment is carried out. The details of each of the steps will be discussed in this section.
Image Acquisition
For image acquisition Olympus BX43 microscope is used. Software used for image acquisition is Olympus CellSens Dimension. In the activated sludge process the wastewater is kept in the aeration tank where air is pumped into the water for microbial growth. The samples to be test are collected from the aeration taken. 12µl of this sample is placed over a slide which is covered by a cover slip of size 18mm2. The resolution of the captured images is 1224 x 960 pixels. For 10x magnification the pixel size is 0.7015 µm/pixel. z-stacking process is also utilized for image acquisition to get good depth of field as the flocs have 3 dimensional structures.6 We have adopted a consistent protocol that scans all samples horizontally and vertically. 40 images have been used in this research.
The background of phase contrast imagesis much darker than that of the bright field images7 as also observed in Figure 1. Filaments are very thin structures and are easily observed in the phase contrast images. The filaments are darker than the background and appear black or purple under phase contrast microscopy. Some of filaments are attached to the flocs, other are occluded by the flocs while some are free from the flocs and are freely floating in the sample as shown in Figure 1.
Gold approximation of ground truth images
The minimum magnification for phase contrast images is set to 10 times which makes the size of objects bigger. The images are manually segmented using GIMP image processing software8 and a drawing pad; which produces approximation of ground truth images. Then, the original images are segmented using proposed segmentation algorithms using MATAB. Finally, the gold approximation images are used to evaluate the segmented images for performance comparison. Figure 3 shows some phase contrast images and their gold approximations for filaments only
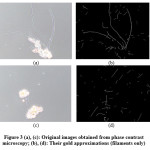 |
Figure 3(a),(c): Original images obtained from phase contrast microscopy;(b), (d): Their gold approximations (filaments only)
Click here to View figure
|
Segmentation algorithms
In this section we will review four state of art segmentation algorithms: edge based algorithm, K-means algorithm, texture based algorithm and watershed algorithm for the segmentation of filaments from phase contrast images. The methods used for segmentation are already established methods, however we will be adapting them for segmenting filaments in phase contrast microscopy,9 in order to get an overview of the techniques that may be suitable for this modality.
Edge based algorithm
The input image acquired using phase contrast microscopy is converted to gray scale image. The images obtained using phase contrast microscopy usually have a fine double edge which is clear on close observation. Sobel filter is commonly used in image processing for edge detection. Here we will be using both horizontal and vertical Sobel edge detector to get the gradient image, it results in the emphasis of the edges. The gradient image thus obtained is then converted into a binary image by using a threshold value. This binary mask is used to sharpen the image by adding it to the original image. Finally the image is segmented using a threshold.10
K-means algorithm
K-means clustering algorithm is an unsupervised clustering method. It uses the mean of the data cluster as the center point .11 K-means randomly selects k number of initial points in the data available, where k is the number of clusters specified. For each iteration the center point of the cluster will change according to the mean of the cluster members. Cluster members will be determined by the distance of each member with the center point of the cluster. The iterations will stop when the center point converges. Good segmentation performance can be achieved if correct number of clusters can be identified.
As a pre-processing step to this method a median filter is applied. Lastly, the image is segmented based on the threshold obtained and converted into binary image.
Texture based algorithm
The RGB image is acquired from phase contrast microscopy is converted into gray scale image. After that, range filter and contrast adaptive limit histogram equalization (CLAHE) are applied for texture analysis12 Finally Otsu’s thresholding method is applied to get the binary image [13].
Watershed algorithm
The image is converted to grayscale image and then pre-processed using top-hat filter. After that threshold is calculated using Otsu’s thresholding method13 which will be used in the process of converting filtered image to the binary image. The distance transform of the complement of binary image is computed in order to find the object in the image. After that, the image is segmented by watershed algorithm.14
Assessment of Algorithms
Assessment of algorithms is the process of measuring the behaviour of an algorithm. The performance metrics used in this paper are non-region based metrics which are Rand Index (RI) and variation of information (VI); and region based metrics which is accuracy.
Rand index (RI)
Rand Index is an assessment metric which measures the probability that arbitrary pair of samples have consistent labels in two regions.15 The range for the Rand Index is [0,1]. Rand index is 0 when segmented image has no similarity with gold image while Rand index is 1 when the segmented image and gold image are identical.
Variation of information
Variance of information measures the total information loss and gain between two clusters. Hence it estimates the connection to which one clustering have with the other.16 This value is inversely proportional to the performance. The lower the value, the better the result. The value may be higher than 1 compared to other metrics.
Accuracy
Accuracy determines the performance of the algorithm with respect to some reference. The accuracy lies within the range.0,1 Where 0 refers to the lowest possible accuracy whereas 1 represents the highest accuracy.
Results and Discussion
In this section, we will discuss the results of the segmentation of phase contrast images for different algorithms. For result of edge based segmentation, most of the filaments are segmented because the filaments have high contrast. The Sobel operator is sensitive to noise which causes degradation of the magnitude of the edges. This will cause the operator to be inaccurate as the magnitude of the edges decrease. As the result, Sobel can’t detect smooth or thin edges. But the filaments are merged together due to closing morphological operation. Hence still the algorithm is able to give the best results. Result of watershed segmentation is almost similar to result of edge based segmentation and 2nd in terms of ranking. The outcome of texture based segmentation is also acceptable however it is unable to segment thin fine filaments.
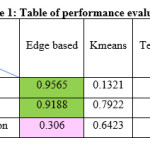
The performance assessments of the segmentation algorithms are illustrated in Table 1. In table 1, the algorithm showing the best result is highlighted in green color and the 2nd in rank is highlighted in pink color. Based on Table 1, the accuracy of the edge based segmentation on phase contrast images is the highest which is 0.9565. The rand index of edge based segmentation on phase contrast images is also the highest which is 0.9188. The variation of information of the watershed segmentation is the best among the segmentation algorithms which is 0.2692. Figure 4 gives an overview of the segmentations for two sample cases. It has been observed from the sample cases that although on the overall basis the assessment of watershed algorithm is better than the texture based method, however on subjective observation we can see that for some images watershed method fails to detect the filaments completely. On close observation it can be seen that the results of texture based method are very close to watershed in terms of accuracy and rand index. Hence it can be established from this observation that not only quantitative analysis is important but in image segmentation it is always advisable to perform a qualitative analysis.
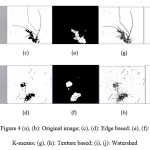 |
Figure 4(a),(b): Original image; (c), (d): Edge based; (e), (f): K-means; (g), (h): Texture based; (i), (j): Watershed
Click here to View figure
|
Conclusion
In this paper segmentation of filaments present in the microscopic images of activated sludge wastewater is carried out using phase contrast microscopic images at 10 times magnification. A total of 40 images have been used for this work. Several basic segmentation algorithms have been implemented. These include edge based, k-means, texture based and watershed methods. Three metrics have been used for performance assessment. It has been observed that there is not any specific algorithm that may fit to all types of input images for good segmentation in terms of quantitative and qualitative assessment. In general Edge and watershed based segmentation worked better for phase contrast microscopy images in quantitative assessment.
References
- Jaccard, Nicolas, Nicolas Szita, and Lewis D. Griffin. “Trainable Segmentation of Phase Contrast Microscopy Images Based on Local Basic Image Features Histograms.” In MIUA. 2014;47-52.
- Su, Hang, Zhaozheng Yin, Seungil Huh, and Takeo Kanade. “Cell segmentation in phase contrast microscopy images via semi-supervised classification over optics-related features.” Medical image analysis. 2013;17(7):746-765.
CrossRef
- Khan, Muhammad Burhan, Humaira Nisar, and Choon Aun Ng. “Image Processing and Analysis of Phase-Contrast Microscopic Images of Activated Sludge to Monitor the Wastewater Treatment Plants.” IEEE Access. 2017.
- Jaccard, N., N. Szita, and L. D. Griffin. “Segmentation of phase contrast microscopy images based on multi-scale local Basic Image Features histograms.” Computer Methods in Biomechanics and Biomedical Engineering: Imaging & Visualization. 2017;5(5):359-367.
CrossRef
- Lee, Xue Yong, Muhammad Burhan Khan, Humaira Nisar, Yeap Kim Ho, Choon Aun Ng, and Aamir Saeed Malik. “Morphological analysis of activated sludge flocs and filaments.” In Instrumentation and Measurement Technology Conference (I2MTC) Proceedings, 2014 IEEE International, IEEE. 2014;1449-1453.
CrossRef
- Nisar, Humaira, Lee Xue Yong, Yeap Kim Ho, Yap Vooi Voon, and Soh Chit Siang. “Application of imaging techniques for monitoring flocs in activated sludge.” In Biomedical Engineering (ICoBE), 2012 International Conference on, IEEE. 2012;6-9.
CrossRef
- Nisar, Humaira, Ho Yuen Hang, Soh Chit Siang, and Muhammad Burhan Khan. “Image segmentation of microscopic wastewater images using phase contrast microscopy.” In Systems, Process and Control (ICSPC), 2016 IEEE Conference on, IEEE. 102-106;2016.
- https://www.gimp.org/
- Khan, Muhammad Burhan, Humaira Nisar, Choon Aun Ng, Kim Ho Yeap, and Koon Chun Lai. “Segmentation Approach Towards Phase-Contrast Microscopic Images of Activated Sludge to Monitor the Wastewater Treatment.” Microscopy and Microanalysis. 2017;23(6):1130-1142.
CrossRef
- Muthukrishnan, R., and Miyilsamy Radha. “Edge detection techniques for image segmentation.” International Journal of Computer Science & Information Technology. 2011;3(6):259.
CrossRef
- Hartigan, John A., and Manchek A. Wong. “Algorithm AS 136: A k-means clustering algorithm.” Journal of the Royal Statistical Society. Series C (Applied Statistics). 1979;28(1):100-108.
- Pizer, Stephen M., R. Eugene Johnston, James P. Ericksen, Bonnie C. Yankaskas, and Keith E. Muller. “Contrast-limited adaptive histogram equalization: speed and effectiveness.” In Visualization in Biomedical Computing, 1990., Proceedings of the First Conference on, IEEE. 1990;337-345.
CrossRef
- Otsu, Nobuyuki. “A threshold selection method from gray-level histograms.” IEEE transactions on systems, man, and cybernetics. 1979;9(1):62-66.
CrossRef
- Steve Eddins, M., 2002. MathWorks. [Online] Available at: www.mathworks.com/company/newsletters/articles/the-watershed-transform-strategies-for-image-segmentation.html
- Rand, William M. “Objective criteria for the evaluation of clustering methods.” Journal of the American Statistical association. 1971;66(336):846-850.
CrossRef
- Meilă, Marina. “Comparing clusterings—an information based distance.” Journal of multivariate analysis. 2007;98(5):873-895.
CrossRef

This work is licensed under a Creative Commons Attribution 4.0 International License.