Samir Kumar Bandyopadhyay
JIS University Kolkata, Agarpara Campus, Nilgunj Road, Agarpara, Kolkata, India.
DOI : http://dx.doi.org/10.13005/ojcst11.03.01
Article Publishing History
Article Received on : 30-09-2018
Article Accepted on :
Article Published :
Article Metrics
Copy the following to cite this article:
BANDYOPADHYAY S. K. Overview Process for Identification of Breast Abnormalities. Orient.J. Comp. Sci. and Technol;11(3) .
|
Copy the following to cite this URL:
BANDYOPADHYAY S. K. Overview Process for Identification of Breast Abnormalities. Orient.J. Comp. Sci. and Technol;11(3) . Available from: http://www.computerscijournal.org/?p=9162
|
Cancer is one of the most virulent diseases in the modern world that still remains a challenge, yet to be fully understood and conquered. Since exact cause of this disease still remains an enigma, preventive measures remain non-existent. It has been reported by several medical scientists that modern day lifestyles, pollution and exposure to hazardous environment may result in mutation of healthy living cells causing cancer. Genetic disorder is also known to cause cancer. Cancer can be found in different parts of the body and is named after the region of their origin like brain cancer, breast cancer, cervical cancer to name a few. Late detection fallouts in higher grade cancer detected with very poor prognosis, consequences into high mortality within few months. Early detection is the only hope for better prognosis andtreatment.1-2
Breast cancer affecting the women is known to cause high mortality unless detected at early stage. Detection requires a simple procedure of Mammography followed by biopsy of the tumor or lesions present in the breast tissue. Contemporary Mammographic hardware has incorporated digitization of output image accordingly increasing the scope for implementation of computational methods towards Computer Aided Diagnostics (CAD). CAD systems require Medical Image Processing, a multi-disciplinary science that involves development of computational algorithms on medical images.3
The digital mammogram image pair is initially pre-processed, the right oriented mammogram is flipped and any unwanted artifacts are removed from the image. This is followed by the crucial step of noise removal using the Gaussian kernel. The image registration and homogeneity enhancement are performed using Divide and Conquer Homogeneity Enhancement algorithm and registration algorithm. Pectoral muscle holds the breast to the body and needs to be suppressed as it mimics the intensities exhibited by tumor. This challenging task is accomplished implementing autonomous algorithm and the pectoral region is masked out leaving behind the breast region of interest. This is followed by the Edge Detection for producing a single pixel thick edge map of the image. Breast contour detection is then performed to separate the region of interest from the background. The anatomical segmentation of the breast image is performed using tracesof eachedgepathinclockwisedirectionto isolate all closed objects within the breast region of interest. Statistical 3σ is used to identify suspected region and any region exhibiting intensity values greater are noted as abnormal regions.4
Sometimes it becomes necessary to identify and monitor high risk patients to prevent fatality. Certain known markers are present requires computational methods to establish these markers. Asymmetry Analysis, is one such marker, is performed both morphologically and anatomically. It is now required to make a geometric triangle to represent each breast. The two obtained triangles are registered on their center of mass and morphological asymmetry percentage is deduced. Density Estimation is performed using the progressive elimination method that utilizes established statistical methods to successively suppress low intensity regions. The resulting high intensity region is then measured to reduce risk factor. Breast volume calculation was initially performed only after surgical removal of breast called mastectomy. A geometric model having one elliptical parabolic inverted over another is used for accurate breast volume measures.
AnatomicalSegmentationofBreastisthebasic step towards determining abnormalities. The input is the mammographic image and outcomeisthesegmentedregionswithintheregion of interest.It is not only segregated the regions but also removes all unwanted dots, edges and discrete objects from the edge map that are insignificant to achieve the desiredobjective. The segmentation is done based on intensity values. Anatomical segmentationis made for each region for finding mass detection. It is shown in figure 1.
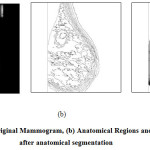 |
Figure 1: (a) Original Mammogram, (b) Anatomical Regions and (c)Mammogram after anatomical segmentation
Click here to View figure
|
The scanning process starts from the first row of the image, proceeds in row major order and terminated at last row. For each pixel the four boundary pixels located north, east, west and south of the pixel is also checked to find out whether they are colored orthey form the boundary pixel. If the pixels are not colored and are not boundary pixels they again form the seed for further searching. Allsuch pixelsarethensearched ontheoriginalimagetogettheirintensityvaluesforcalculatingtheModevalue.Thepixel locations of each region are then replaced by the computed Mode valueintensity.
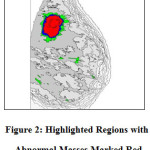
The abnormal region is present within these regions with some asynchronous characteristics. The objective is to extract these characteristics features to prove the abnormalitiespresent.Toidentifytheabnormalitiesadecisionmakingsystemisproposed here. The distribution of the colors is analyzed through a step by step statistical eliminationmethod.The colored region is marked as abnormal region and it is shown in figure 2.
The identification process of disease like cancer is of two folds. The initial process is detection followed by diagnosis for final conclusion. In general, doctors analyze the externally accessible characteristics such as shape, size, topology, texture and results of different medical test conducted like x-ray, mammogram, MRI etc. Still conclusive inference can only be drawn by analyzing the hidden information embedded deep inside the tissues. Breast cancer identification also follows the same path. The digital mammographic imaging is the most trustworthy process for early detection of breast abnormalities. However, confirmation can only be realized by analyzing the histopathological biopsy slide.
Recent studies reveal that majority of clinical tests including digital mammography and biopsies performed are benign, resulting in wastage of valuable time of medical practitionersandatthesametimeincreasingthepossibilityoffalsedetection.Theefficient CAD system can screen the benign cases and assist the experts in terms of qualitative and quantitativeprecision.
References
- Albregtsen et al, “Adaptive grey level run length features from class distance matrices”, International Conference on Pattern Recognition, 2000.
- Bahlmann et al, “Automated Detection of Diagnostically Relevant Regions in H&E Stained Digital Pathology Slides”, Proceedings SPIE 8315 Medical Imaging2012,Computer-Aided Diagnosis, 2012.
- Bellotti et al, “A completely automated CAD system for mass detection in a large mammographic database”, Medical Physics, 2006.
CrossRef
- Ponti, A. et al.,” Cancer screening in the European union. final report on the implementation of the council recommendation on cancer screening”, 2017.

This work is licensed under a Creative Commons Attribution 4.0 International License.