Introduction
Breast cancer develops from cells lining the milk ducts and slowly grows into a lump or a tumour. It is thought that it takes about 10 years for a tumour to become 1 cm in size starting from a single cell. A malignant tumour has the ability to spread beyond the breast to other parts of the body via the lymphatics or the blood stream.1-3 Breast cancer may be invasive or non-invasive. Invasive cancer spreads from the milk duct or lobule to other tissues in the breast, whereas, non-invasive ones lack the ability to invade other breast tissues. Non-invasive breast cancer is called “in situ” and may remain inactive for entire lifetime.
Each year, breast cancer is newly diagnosed in more than 1 million women worldwide and more than 400,000 women die from it.4-6 Breast cancer as a public health problem is growing throughout the world, but especially in developing regions, where the incidence has increased as much as 5% per year.7-9 The mortality incidence ratio is much higher in developing countries than in developed countries. The increasing burden of breast cancer is also acknowledged in the resolution on cancer prevention and control, as adopted by the 58th World Health Assembly in May 2005. Therein, members are urged to develop and reinforce comprehensive cancer control programs to reduce cancer mortality and improve quality of life for patients and their families.2
It is the objective of the paper todevelop a window based software that can read Digital Mammogram images and can perform fully autonomous CAD analysis on the images that will aid physicians and radiologist worldwide. It will perform relevant feature extraction from a given mammogram image or a pair of images to identify and isolate specific abnormalities if present from the given set of images of a patient.
Literature Reviews
Early and efficient detection followed by appropriate diagnosis is the most effective way for treatment and reduce mortality. Breast cancer screening is performed a professionally medical examination to check women’s breasts for abnormalities such as tumour and cysts while biopsy is the process to identify malignancies. Several screening techniques can be used to examine the breast including Ultrasound imaging, which uses a band of high frequency sound waves to probe the breast. Magnetic Resonance Imaging (MRI), which probes the breast using powerful magnetic fields and Mammography, which produces X-ray images of the breast. Among all screening associated with clinical breast examination, Digital Mammography has been proved to be the most effective and reliable screening method for early breast tumour detection and the surgical biopsy is the proven method for confirmation of breast malignancy.10-13
Today it is observed that cancer is now common disease for human.14 In comparison to other cancer diseases breast cancer indicates high rate of risk factor.15 It is now confirmed that Digital Mammography has sensitivity and specificity of 62% and 90% respectively, while the corresponding values for the clinical breast examination (CBE) evaluation are 24% and 95%.19
Computer technology through Computer-Aided Diagnosis (CAD) has had a tremendous impact on medical imaging.16-18
Proposed Method
The aim of this research work is to develop a comprehensive, fully automated and low cost CAD tool to detect early signs of breast abnormalities and assist the experts in interpreting the same towards diagnosis of breast cancer. The aim of breast cancer research can be divided into three distinct parts. The initial part is focused on identifying breast abnormalities in mammographic screening. Breast abnormalities detection using mammogram is a well-known field of research and some significant works have been carried out worldwide. Recent data shows that increasing number of countries have started mass screening programs that have resulted in a large increase in the number of mammograms requiring interpretation. Estimates indicate that between 10 and 30 per cent of breast radiologists miss cancers during routine screening. This paper provides both effective and efficient improvements over existing algorithms and introduces some innovative ideas based on image segmentation process to help the radiologists in making accurate interpretation of the digital mammograms.
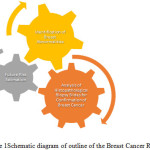
The second part of the research is to determine the future risk of breast cancer from digital mammographic images. The exact cause of breast cancer is not identified but researchers showed that there are some morphological and anatomical characteristics which can be the indicators for future risk. There are some sporadic works has been done in this direction yet there is no comprehensive outcome available in the public domain. The characteristics features like asymmetry, volume and density are used in this research to predict the potential future risk factors. Figure 1 indicates outlines of Breast Cancer Research.
The proposed work is a true effort towards building a comprehensive low cost solution which not only analyses the visual signs of mammogram for detection of abnormalities but also capable of determination of future risk factor and an introductory study on histopathological biopsy slide analysis for true diagnosis of breast cancer. The proposed tool is not sublimating the classical clinical process but it will be regarded as a supportive aid to medical practitioners for efficient and accurate diagnosis of breast cancer. Most of the CAD research with respect to mammogram images is confined to only tumour detection. The proposed fully automated system will be able to detect different abnormalities of the breast along with tumour. The system will also provide information regarding potential future risk to patients and analyse histopathological biopsy slide towards confirmation of breast cancer. The system is focusing on four different problems that deal with high risk conditions that develop in patients.
Breast tumour can be malignant or benign. Identification and localisation of the tumour is essential before conducting any surgical methods. The system will identify, locate and calculate the extent of the tumour. It will be able to track the development of the tumour over time.
Deriving breast volume from mammographic measurements has received less attention as only few applicable formulas have been published in the literature although it is most vital area for automated computerised systems. With increasing emphasis on the breast cancer diagnosis, followed by cosmetic outcome of breast surgery, the role of breast volume estimation becomes more important. It helps the surgeon predict the aesthetic of various breast surgeries on women and guides the choice of the most appropriate treatment.
The proposed system will not only concentrate on asymmetry in anatomical regions but will also establish structural asymmetry within the pair of mammograms There is a high correlation between high breast parenchymal density and high risk of breast cancer. The proposed system uses the suggested density estimation algorithm and classifies the mammograms according to BI-RAD system of classification. Proposed CAD system can be used to guide patients, doctors, surgeons and radiologist for effective treatments.
To establish the confirmation and make it a true diagnosis tool, the research incorporates the histopathological biopsy slide analysis. The proposed tool is able to clear the insignificant part from the slide and enhance the significant portion for taking appropriate decision making.
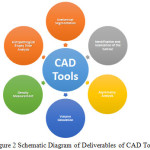
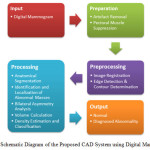
The proposed tool will provide a fully autonomous feature analysis of mammogram images of a particular patient. Such tool will help to analyse huge volume of digital mammograms within a very short period of time thus reducing the burden on the radiologist who can now concentrate only on those mammograms that have detected some abnormalities. Figure 2 describes the deliverable CAD tools.
The data driven CAD system will be able to determine the presence of breast tumour and localisation of any identified tumour or abnormality. The system will also calculate the volume and determine structural or anatomical asymmetry that may exist within a pair of mammograms. The proposed system will also determine the breast parenchymal density to identify potentially high risk patients. These patients can then be monitored so that early detection of any abnormalities can be established.
The diagnostic part of the tool can be used for confirmatory test using histopathological slide of surgical biopsy. An introductory pre-processing of slide images has been presented in this research work. Detailed analysis of Histopathological slide image has been left for future research work. It is expected that the system will be able to analyse huge number of slides for obtaining the desirable outcome more accurately in very short time.
The mammogram screening technique can only detect the abnormalities like presence of tumours or cysts. According to the cancer experts, some morphological and anatomical signs in mammogram are significant for future risk determination of breast cancer development. This paper has comprehensively covered the entire cycle starting from identification of abnormalities to risk determination from digital mammogram.
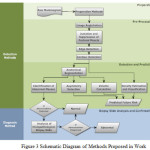
The schematic diagram in figure 3 summarizes the entire research work presented in the paper is shown in figure 3.
Analysis of the proposed algorithms is essential to show the effectiveness of the algorithms. Analysis of the newly proposed algorithms includes determination of quantitative, qualitative, comparative and complexity measures. The proposed methods have been rigorously tested using internationally available benchmarked database like “The Mammographic Image Analysis Society Digital Mammogram Database” (MIAS), “The Digital Database for Screening Mammography” (DDSM) databases and Lawrence Livermore National Laboratories (LLNL) along with University of California at San Francisco (UCSF) radiology department database for digital mammogram and for histopathological biopsy slides analysis the OriGene Technology Database.
The proposed methods on mammogram will identify the abnormalities; gather important information and magnitude of the problem. An analogy can be easily done very quickly whether the patient should be recommended for surgical biopsy or not. In case of malignancy, quick and correct detection is most important for further treatment. We now discuss briefly about the necessary modules and their functioning which is developed in the proposed work.
Development of Data Set
The dataset for our work will be digital mammogram images. The mammogram images can be collected from several Diagnostic centres and hospitals will be digitized with scanners to bitmap images. Similarly mammogram images can also be obtained as raw data from the mammographic machines and can be further processed or converted to bitmap images for processing. For experimental analysis we have used the mammogram images provided by the popular (MIAS) and (DDSM) databases.
Image Processing
Image processing algorithms will be proposed, developed and implemented on the obtained dataset to achieve the deliverables of the research. The mammogram images will be prepared and pre-processed before starting of actual process. The obtained pre-processed images will then be analysed for generating critical information. The main objective of this process is to improve the quality of the image to make it ready for further processing.
Artefact Removal
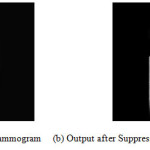
The first step is to determine the Orientation of the Mammogram. The image is flipped horizontally if needed to place the asymmetric region below the vertical centroid, resulting in an image that is right way up. Next major step is to suppress the noise from the mammogram. There are different types of noises, which appear in mammogram images. The proposed methods need to estimate these regions and exclude them from the remaining process. Algorithms will be proposed for image orientation and complete noise suppression. Figure 4 describes the process for noise removal.
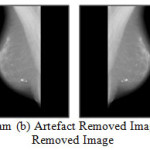 |
Figure 4: (a) Original Mammogram (b) Artefact Removed Image (c) Flipped Image (d) Noise Removed Image
Click here to View figure
|
Pectoral Muscle Suppression
The pectoral muscle in mammograms acts like an additional complexity in automated analysis using CAD systems. The elimination of pectoral muscle is very important in automated detection of masses in mammographic images. The fully automated algorithm is proposed to suppress pectoral muscle to obtain the region of interest (ROI). Figure 5 shows image after suppression pf Pectoral Muscle.
Pre-processing Method
Beast Image Registration, Edge Detection and Breast Contour Determination are the part of pre-processing method. These sequential steps are mandatory before starting the actual processing of image.
Beast Image Registration
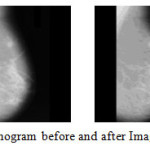
Medical image registration is the process of transforming different sets of data into one coordinate system. Medical image registration often additionally involves elastic (non-rigid) registration to cope with deformation of the subject. In this research a set of registration algorithm is proposed which will help to get accurate results for the later methods.Figure 6 depicts Mammogram before and after Image Registration.
Edge Detection & Contour Determination
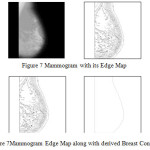
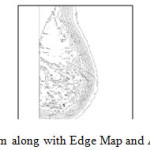
In this research a new algorithm for edge detection has been proposed for mammographic images. We also suggest an automated breast contour extraction and nipple detection algorithm in this research. Automatic segmentation of the breast contour, extraction of breast contour and nipple detection is a necessary and important step for typical CAD systems. It is to identify the breast region independent of the orientation of the breast in the image. It should also have a fast running time and be adequately precise, so as to improve the accuracy of the overall CAD system.Figure 7 describes Mammogram with its Edge Map. Figure 8 Shows Mammogram Edge Map along with derived Breast Contour.
Processing Steps
The processing phase is consisting of Anatomical Segmentation, Identification and Localization of Abnormal Masses, Bilateral Asymmetry Analysis, Volume Calculation and Density Estimation and Classification. Now details are stated under subsequent headings.
Beast Anatomy Segmentation
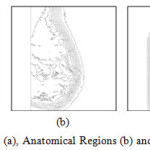
Asymmetry analysis is very important not only to identify masses but also to predict future risk, cosmetic and reconstruction surgery of breast. Figure 9 describes Mammogram along with Edge Map and Anatomical Regions.
Identification and Classification of Abnormal Masses
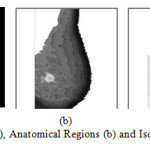
Circumscribed or well defined masses, spiculated masses, other ill-defined masses and clustered micro-calcifications are the most common lesions associated with the presence of breast carcinomas. The tumoral masses present as thickenings, which appear on images as lesions. These lesions can vary considerably in optical density, shape, position, size and characteristics at the edge. In addition, it is difficult to identify morphological, directional or structural quantities that can characterize the lesions sought at any scales and any modalities of occurrence. Therefore, for a CAD system it is very demanding to detect lesions of various types. In this research work, more than one fully automatic methods are proposed to isolate and classify the abnormalities in mammogram. Figure 10 views Mammogram (a), Anatomical Regions (b) and Isolated Abnormal Masses (c). Figure 11 describes Mammogram (a), b) Anatomical Regions (b) and Isolated Abnormal Masses (c). Figure 12 demonstrates Schematic Diagram of the Proposed CAD System using Digital Mammogram.
Volume Calculation
The calculated volumes are obtained by algebraic formulas or computerized algorithms that approximate the shape of the image structure. Deriving breast volume from mammographic measurements has received less attention and to my knowledge only few applicable formulas have been published in the medical literature although it is most vital area for automated computerized systems. With increasing emphasis on the breast cancer diagnosis, followed by cosmetic outcome of breast surgery, the role of breast volume estimation becomes more important. It helps the surgeon predict the aesthetic effect of various breast surgeries on women, and guides the choice of the most appropriate treatment. An algorithm is developed to improve the results of mammographic volume calculation. Figure 13 describes experimental result on Mammogram of CC and MLO views along with the final 3D structure for representation of human breast
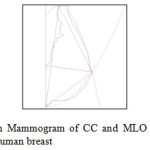 |
Figure12: Experimental result on Mammogram of CC and MLO views along with the final 3D structure for representation of human breast
Click here to View figure
|
Bilateral Asymmetry Analysis
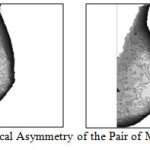
Asymmetry in anatomical regions will be identified and calculated in a pair of mammograms. Percentage of asymmetry will be obtained by comparison. Asymmetry analysis is very important not only in identification of diseases but to predict future risk, cosmetic and reconstruction surgery. We have proposed a method to identify the degree of bilateral asymmetry of the breast. Figure 14 shows Computed Triangles for the Pair of Mammogram image by showing the respective Landmark points and indicating morphological Asymmetry.Figure 15 Shows Anatomical Asymmetry of the Pair of Mammogram image.
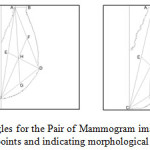 |
Figure13: Computed Triangles for the Pair of Mammogram image showing the respective Landmark points and indicating morphological Asymmetry
Click here to View figure
|
Density Estimation and Classification
There is a high correlation between high breast parenchymal density and high risk of breast cancer. In this work, a new automated breast parenchymal density estimation algorithm is proposed, using segmentation. Figure 16 shows Mammogram (a), Prepared Mammogram (b), Isolated Dense Region (c), Masked Dense Region on Mammogram (d) and Boundary of Dense Region of Mammogram (e).
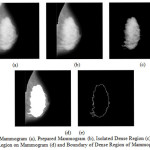 |
Figure15: Mammogram (a), Prepared Mammogram (b), Isolated Dense Region (c), Masked Dense Region on Mammogram (d) and Boundary of Dense Region of Mammogram (e)
Click here to View figure
|
The window based software we proposed to develop will integrate all the image processing algorithms proposed by us with the obtained dataset of mammogram images to attain the deliverables. The system will be able to identify specific abnormalities and localize them.
Performance evaluation in algorithms design is an important step that is commonly neglected. What constitutes an “acceptable” result differs significantly, and is often based on visual subjective opinion with very little quantitative endorsement. The accuracy of these algorithms was evaluated through quantitative measures derived through the comparison of each segmented “mask” with its corresponding “gold standard”. The gold standard is generated by manually segmenting the regions from each mammogram. The boundary of the Regions is then manually traced using general purpose image processing software to extract the real regions from mammogram image. The generated Ground Truth (GT) obtained for each region was referred to the radiology department for confirmation before comparison.
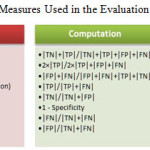
The region extracted by the segmentation algorithm (mask), which matches the GT, is denoted as true positive (TP) emphasizing that the algorithm has indeed found a portion of the region. Pixels shown in the GT but not shown in the mask are defined as false negative (FN) classifications. The pixels not in the GT, but in the mask are defined as false positive (FP) pixels. From this we can derive metrics as stated table 1.
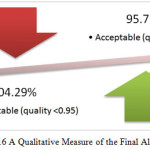
No algorithm can be considered 100% robust, especially considering the heterogeneous nature of mammograms. In our case study of mammograms, only 4.29% fell marginally short of acceptable benchmark (i.e. 0.95%) where 95.71% achieve the accuracy indicator specified. Figure 17 indicates Qualitative Measure of the Final Algorithm.
Results
The results obtained during Experimental Evaluation on the normal and abnormal cases are further analyzed using statistical methods to indicate that the abnormal mammograms show distinct characteristics in comparison to normal one. During the generation of the distinct regions within the mammogram we have also categorized and enumerated each region along with their respective Statistical Mode value. The available dataset is used for further statistical analysis consist of Fatty, Fatty-Fibro Glandular and Dense-Fibro Glandular mammogram of normal and abnormal cases. First we calculate the Arithmetic mean for the distribution to obtain the deviations of each region, so that we derive the Standard Deviation of the dataset. We then calculate the Z score to normalize the distribution. We truncate the Z values that are negative as they do not influence the abnormal regions. Using the obtained truncated dataset we have calculated the truncated mean and the Standard Deviation (σ) of the apportioned dataset. Finally, we calculate the 2σ and 3σ of the population. The results indicate that the abnormal region lies on or above the 3σ mark. The control image (normal mammogram) is devoid of this region in the graph. Figure 18 (a) shows Normal case where (b), (c) and (d) show abnormal cases of Fatty, Fatty-Fibro Glandular and Dense-Fibro Glandular mammogram.
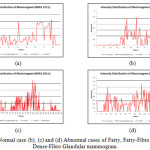 |
Figure17: (a) Normal case (b), (c) and (d) Abnormal cases of Fatty, Fatty-Fibro Glandular and Dense-Fibro Glandular mammogram.
Click here to View figure
|
Conclusions
Human breast like any other organ of the human body is a complex structure containing different tissues with various organs. The breast also undergoes transformation during the life time of the female depending on the hormonal changes that occur from puberty through lactating mother to post menopause. Complexity grows further due to its classification of Fatty, Fatty-Fibro Glandular and Dense-Fibro Glandular structure. So, image produce by the mammogram is also varies substantially depending on the diversity of breast size, shape and structure. Considering all the parameters, our proposed algorithms are sufficiently showed good results which is acceptable mathematically as well as statistically too. We have compared our results with different national and international research in the related field and found that it is not only achieving standard level but it gives better results in some cases in terms of accuracy and sensitivity than others. In the process of development of algorithms, we are very much critical about the complexity of algorithm in terms of time and space. So, in conclusion, we believe that wecan convert the research to an integrated package the proposed CAD system due its quality.
Acknowledgement
First I acknowledgement Radiologists who help us a lot for guidingproper diagnosis. Next, JIS University Medical Laboratory has been allowing us for doing research works.
References
- Ball et. al., Digital Mammogram Spiculated Mass Detection and Spicule Segmentation using Level Sets, Proceedings of the 29th Annual International Conference of the Institute of Electrical and Electronics Engineers Engineering in Medicine and Biology Society. 2007;4979–4984.
CrossRef
- Ball et. al., Digital Mammographic Computer Aided Diagnosis (CAD) using Adaptive Level Set Segmentation, Proceedings of the 29th Annual International Conference of the Institute of Electrical and Electronics Engineers Engineering in Medicine and Biology Society. 2007;4973–4978.
CrossRef
- Bloomquist et. al., Quality control for digital mammography I The ACRIN DMIST trial, Medical Physics. 2006;33(3):719–736.
CrossRef
- Bottigli et. al., Superior Performances of the Neural Network on the Masses Lesions Classification through Morphological Lesion Differences, International Journal of Biomedical Sciences. 2006; 1(1):56-63.
- Cerello et. al., GPCALMA: a GRID based tool for mammographic screening, Methods of Information in Medicine. 2005;44(2):244-48.
CrossRef
- Chaloeykitti et. al., Artefacts in mammography: ways to identify and overcome them, Singapore Medical Journal. 2006;47(7):634–640.
- Chan et. al., Digital Mammography: ROC Studies of the EIects of Pixel Size and Unsharp-mask Filtering on the Detection of Subtle Microcalcifications, Investigative Radiology. 1987;22(7):581-589.
CrossRef
- Chandrasekhar et al, A simple method for automatically locating the nipple on mammograms, The Institute of Electrical and Electronics Engineers Transactions on Medical Imaging. 1997;16(5):483–494.
CrossRef
- Chandrasekhar et. al., Automatic Breast Border Segmentation by Background Modeling and Subtraction, proceedings of the 5th International Journal on Graphics Vision and Image Processing International Workshop on Digital Mammography. 2005;5(2):560-565.
- David et al., Breast Segmentation with Pectoral Muscle Suppression on Digital Mammograms, Springer-Verlag Berlin Heidelberg. 2005;3523:471–478.
- Davies et. al., The Automatic Computer Detection of Subtle Calcifications in Radiographically Dense Breasts, Physics in Medicine and Biology. 1992;37: 1385-1390.
- Davis., A survey of edge detection techniques, Computer Graphics and Image Processing. 1975;4(3):248-260.
CrossRef
- Dengler et.al., Segmentation of Micro-calcifications in Mammograms, Institute of Electrical and Electronics Engineers Transactions on Medical Imaging. 1993;12(4):634-642.
- FabioA.spanhol, et.al., A dataset for breast cancer histopathological image classification”, IEEE TRANSACTIONS ON BIOMEDICAL ENGINEERING. 2016;63(7).
- Shen-Chuan Tai et.al., An Automatic Mass Detection in Mammograms Based on Complex Texture Features, IEEE JOURNAL OF BIOMEDICAL AND HEALTH INFORMATICS. 2014;18(2).
- Ibrahim Mohamed Jaber Alamin, et.al., Improved Framework for Breast Cancer Detection using Hybrid Feature Extraction Technique and FFNN International Journal of Advanced Research in Artificial Intelligence. 2016;5(8).
- M Venkatramana., et.al, Review of recent texture classification methods, IOSR journal of computer engineering2278-8727. 2013;14(1 ):54-60.
- Anupa Maria Sabu., et.al, Txtural features based breast cancer detection: Asurvey, journal of emerging trends in computing and information sciences. 2012; 3(9).
- R Jeevidha ., V, Sowmiya , K, Kiruthiga ., R, Priya., Collaboration Complexity Reducing Strategy In Cloud Computing, International Innovative Research Journal of Engineering and Technology. 2017;02(04):124- 128.

This work is licensed under a Creative Commons Attribution 4.0 International License.
 and Samir Kumar Bandyopadhyay2