Helen Treasa Sebastian and Rupali Wagh
Department of Computer science, Christ University, Bangalore, India
Corresponding author Email: helen.sebastian@cs.christuniversity.in
DOI : http://dx.doi.org/10.13005/ojcst/10.01.28
Article Publishing History
Article Received on : March 13, 2017
Article Accepted on : March 16, 2017
Article Published : 24 Mar 2017
Article Metrics
ABSTRACT:
Since the beginning of data mining the discovery of knowledge from the Databases has been carried out to solve various problems and has helped the business come up with practical solutions. Large companies are behind improving revenue due to the increase loss in customers.
The process where one customer leaves one company and joins another is called as churn. This paper will be discussing how to predict the customers that might churn, R package is being used to do the prediction. R package helps represent large dataset churn in the form of graphs which will help to depict the outcome in the form of various data visualizations. Churn is a very important area in which the telecom domain can make or lose their customers and hence the business/industry spends a lot of time doing predictions, which in turn helps to make the necessary business conclusions. Churn can be avoided by studying the past history of the customers. Logistic Regression is been used to make necessary analysis. To proceed with logistic regression we must first eliminate the outliers that are present, this has be achieved by cleaning the data (for redundancy, false data etc) and the resultant has been populated into a prediction excel using which the analysis has been performed.
KEYWORDS:
Churn, R Tool; Telecommunication; and Data mining; Logistic Regression
Copy the following to cite this article:
Sebastian H. T, Wagh R. Churn Analysis in Telecommunication Using Logistic Regression. Orient.J. Comp. Sci. and Technol;10(1)
|
Copy the following to cite this URL:
Sebastian H. T, Wagh R. Churn Analysis in Telecommunication Using Logistic Regression. Orient.J. Comp. Sci. and Technol;10(1). Available from: http://www.computerscijournal.org/?p=5040
|
Introduction
There are a number of telecommunication networks that are available and we have the luxury to choose the one we want based on our requirements. The increased number of telecoms are a challenge to the telecom companies and many companies are facing huge revenue losses , to keep the customers many companies invest a huge revenue in the beginning and thus it becomes very important for the customers to expand the business and get back the amount that has been invested in the business .
The increase in the number of churn customers is become the present day challenge to the telecom industry and such customers create financial burden to the company, identifying such customers is the objective of this research paper. Research indicates that the cost of developing a new customer is approximately 5 higher than retaining the new customer.
This paper provides an overview of doing a logistic regression with R studio to do an analysis on the CRM data and come up with the churn prediction. This helps solving many business related problems. This paper summarizes on the prediction with graphically representing the result in Power BI where the actuals and the predictions are present and based on which we are also predicting the accuracy of the model based on the accuracy business can decide if this approach helps improve business or a better approach must be followed.
The voluntary and involuntary techniques for customer relationship management are also discussed in brief.
Web Chin-Ping Wei and I-Tang Chiu proposed the churn prediction technique for customer retention analysis. The author used the decision tree approach C4.5 on customer call details. Yi-Fan wang, Ding-A chlang and Mei-Hua Hsu discussed a Recommender system for customer churn by proposing a decision tree algorithm. Data used for the analysis has covered over 60,000 transactions and of more than 4000 members, over a period of three months. Jadhav and Pawar designed a decision support system using data mining technique. The churn behavior of customers is predicted in advance using this technique. The authors have used Back propagation algorithm on a customer billing data. Tomas Philip Rúnarsson,Ólafur Magnússon, Birgis Hrafnkelsson constructed a churn prediction model that can output the probabilities that customers will churn in the near future. In this paper we will be doing churn analysis for telecom domain with the approach of logistic regression and then computing the result graphically in power BI. Telecommunication industry can also use this approach to customer retention activities within the context of their Customer Relationship Management efforts.
Churn Prediction
In terms of telecommunication the customers leaving the current company and moving into another is called as churn, and in the present scenario considering the surge in the number of churn customers the industry is trying its best to retain the profitable customers and this is named as churn management.
The objective of the paper is to classify the possible customers that might churn
In many areas statistical analysis is used to predict the customers that might churn.
The outcomes of churn analysis are the below
- Improved retention
- Propensity modelling
- Prioritized marketing
- Increased customer value
The types of churn can be classified as
- Voluntary churn
- Involuntary churn
When the industry decides to eliminate the customer then it becomes an involuntary churn. The reason behind this might be due to fraud activities, nonpayment of bills and people who would not use the services. When the customer decides to leave the company then it becomes a voluntary churn and such kind of churn happens in a abrupt and unexpected manner. So it is very important to identify the customers that might churn and avoid the same, this can be achieved by doing a churn analysis.
Churn Managemet
Since acquiring new customers is challenging it is very important to retain the current customers.
Churn can be reduced by analyzing the past history of the potential customers systematically. Large data is maintained about the customers and on performing a proper analysis on the same it is possible to predict the probable customers that might churn. The information that is available can be analyzed in different ways and thereby provide various ways for the operators to envisage the churning and evade the same.
Data collection
For analysis the data that is available in the telecom dataset has been used and prediction has been done for the same.
Data preparation
Before the data can be analyzed we have to clean the data and keep it ready so that the desired results can be derived from it. Data has be clean so that the redundancy and errors can be removed because having such data will lead to incorrect results as well.
In this paper a Churn Analysis has been applied on Telecom data, here the agenda is to know the possible customers that might churn from the service provider. R programing is used for the same this will help give a statistical computing for the data available, here backward logistic regression is been used to achieve the same. The end result would give us the probability of churn for each customer.
Here to do churn analysis Logistic regression is been used, Logistic regression is a statistical method here the resultant variable is categorical, rather than continuous. Logistic regression limits the prediction to be in the interval of zero and one.
In this paper we are using Backward stepwise regression, this involves taking all the variables into consideration then testing the deletion of each variable with a certain criteria that is applied to it and this will be continued till there are no further variables that are available to be deleted without any statistical loss of fit.
The dataset that is used has 22 variables available. These are related to Gender, customer_id, PhoneService etc. The dataset has over 2000 customer related information available.
After applying backward regression the approach inserted the new cleaned data into a new file called as the “prediction” file and this is having an extra column called “probability”. This new column will give the probability of the customers that might churn from the telecom provider, here the data that is used is of 2016 and we know the customers that are churned, we are trying to use backward regression model here and thereby come to conclusion is the model is accurate and based on the accuracy then decide if the model has to be considered for future predictions or not.
Prediction
The business is interested in the final product and it is very important to represent your result in a “graphical representation” such a way that it is understandable and the result helps business make the needed predictions which in turn brings profit. There are many tools that help achieve the same for example, Tableau, Power BI, qlikview etc.
Data Visulation Tools
The best way to get your message across is to use visualization tools, by representing data visually it is possible to uncover the surprising patterns and the patterns that would go unnoticed if we took the stats alone. Here “Power BI” is the tool that is used to do data visualization. Power BI is a business analytics tool it is provided by Microsoft using which reports can be created.
Here in this approach, data is already cleaned and the result is populated in a file called “Prediction” which will be used to visually show how the data appears and the impact.
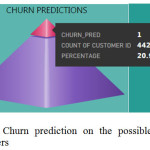
The churn value is represented and given as below. The churn value in the below graph is 20.93% these are the possible customers that would churn from the telecom service provider.
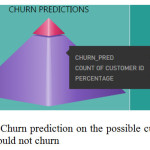
Here the graph shows the remaining 79.07% would not churn from the service provider. They are of no risk to the business. There are many factors based on which we can come to a conclusion if the customer would churn or not. The churn prediction based on various factors like age, tenure, job, payment details, gender, call time, tech support usage etc. can be achieved. Below a few tables are used to predict the possible domain or the kind of people that a likely to churn.
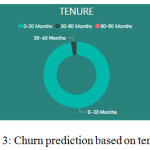
Based on Tenure
In the graph given below it is clearly stated that from a range of 0-30 months are the people who are most likely to churn and 30-60 months most likely not and anything above 60 months are customers who would ideally not churn.
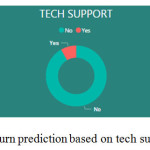
Based on customers who use Tech Support
In the graph given below we can clearly come to a conclusion that people who use tech support are the ones that would not churn where as if the customers who are not using the technical support are possible to churn, this might be due to the lack of knowledge about the services that are provided by the telecom so it is very important to highlight the kind of customer services that are been provided so that the services can be put to the right use and thus prevent the customers from churning.
To check for the accuracy of the model
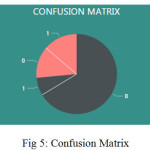
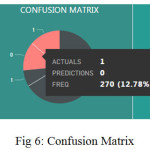
This paper has used a confusion matrix table which has variable Actuals, Frequency and Prediction this confusion table will help describe the performance of the model.
In this model when the “Actuals=1” then the “Predictions must also be=1”, but as we can see in the below graph at one point when the “Actuals=1” the “Predictions=0” so this model is not totally reliable since the accuracy is not 100%.
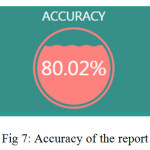
Using accuracy we can get to know the accuracy of the model here the model is 80.02% accurate.
The accuracy is good enough for a churn prediction but it is not very accurate, hence using SVM(Support vector regression) with R we can get accurate probability and thus the result will be more reliable another method of getting high accuracy is by increasing the number of variables that is been used.
When more variables are there to do the comparison the result will be precise and thus the business can do a near real time prediction with the given data.
Results
Telecommunication industry always suffers from a very high churn rates when one industry offers a better plan than the previous there is a high possibility of the customer churning from the present due to a better plan in such a scenario it is very difficult to avoid losses but through prediction we can keep it to a minimal level. In this paper the method used is Logistic Regression (backward logistic regression) and this helps to identity the probable churn customers and then make the necessary business decisions. Using a decision tree would give a more appropriate result, by using logistic regression the result achieved is 80.02% accurate.
Future Scope
The future scope of this project would be to get an accuracy of 100% and for this we can make use of decision tree and in particular using a hybrid classification techniques to point out existing suggestion between churn prediction and customer lifetime value. The result and the accuracy can be bettered if we use more variables in the data. The dynamic nature of the industry has ensured that data mining has been increasingly significant and the industry is totally relying on the results that the data would help predict.
References
- Data mining A tutorial based premier, Richard J. oiger, Michael Geatz.
- http://www.adobe.com/in/solutions/digital-analytics/customer-churn-analysis.html
- Business Intelligence and Insurance, White Paper, Wipro Technologies,Bangalore,2001
- ftp://cran.r-project.org/pub/R/doc/contrib/Zhao_R_and_data_mining.pdf
- Jiawei Han and Micheline Kamber, Data mining,concept and techniques” http://www.cs.sfu.ca.
- http://www.alteryx.com/solutions/customer-churn-analytics
- L. Yangi , C. Chiu , Subscriber Churn Prediction in Telecommunications
- http://www.rdatamining.com/
- N. Kamalraj, .A.Malathi, Applying Data Mining Techniques in Telecom Churn Prediction, in proc.International Journal of Advanced Research in Computer Science and Software Engineering, 10, October 2013.
- http://www.ats.ucla.edu/stat/r/dae/logit.htm
- Telecommunication Subscribers‘ Churn Prediction Model Using Machine Learning Saad Ahmed Qureshi, Ammar Saleem
- https://www.analyticsvidhya.com/blog/2015/11/beginners-guide-on-logistic-regression-in-r/
- Rehman, Ali Mustafa Qamar, Aatif Kamal
- Data Mining in the Telecommunications Industry, Gary M. Weiss, Fordham University, USA.
- Allahyari Soeini and Keyvan Vahidy Rodpysh
- https://powerbi.microsoft.com/en-us/what-is-power-bi/
- https://www.tutorialspoint.com/r/
- Wei, I. Chiu, Turning telecommunication call details to churn prediction: a data mining Approach expert System with applications.

This work is licensed under a Creative Commons Attribution 4.0 International License.