Introduction
In the same way as any wrongdoing aversion technique, the way to minimizing the danger of fraud lies in understanding why it happens; in recognizing business territories that is at danger and actualizing methods tending to powerless regions. Fighting fraud danger ought to along these lines be a two dimensional methodology. To begin with, guaranteeing that the open doors don’t emerge and, second, guaranteeing that the fraudster trusts that he will be gotten and that the potential prizes don’t make the outcomes of being gotten beneficial. With the point of avoiding fraud, the national banks ought to consider forcing controls on the banks by authorizing their structure for fraud hazard insurance coverage [6].
Fraud is an idea that is for the most part seen however whose attributes are regularly not perceived until it is past the point of no return. The frequency of misrepresentation has been ascending amid the worldwide emergency all over on the planet and also in Albania itself. Most deceitful acts are executed by representatives who comprehend the interior operations at their working environment and exploit inner control shortcomings [6].
So prevention & detection of Fraud & any anomaly before it happened or converted in to unmanageable situation is best solution.
OUNCE OF PREVENTION = POUND OF CURE
Problem Statement
The essential motivation to utilize Graph database to handle fraud is on account of a great deal of inside control frameworks have genuine control shortcomings [1]. Keeping in mind the end goal to successfully test and screen inner controls, associations need to take a gander at each exchange that happens and test them against built up parameters, crosswise over applications, crosswise over frameworks, from divergent applications and information sources[3][4]. Most interior control frameworks essentially can’t deal with this in the event of case of relational database systems.
Detailed logs of all exercises performed. You can run an application or a script, enter a few information, and discover a few irregularities. That is awesome, yet you’re going to need some kind of verification of what you did to reveal that fake movement. That verification must be particular and point by point enough to face further misrepresentation examination [2].
Objective of This Research
In this paper, our objective is to recognize questionable patterns in the information gathered from information obtained from bank & financial institution. Furthermore, we are using graph database, not relational database system. We need to identify pattern taken from previous studies of frauds & identify any suspicious activity within system. Then analyze data with optimization technique for better solution & proof of Fraud detection [8].
Create graph database from structured database by adding properties to nodes and defining relationship between them. Create query- Algorithm has been developed for the retrieval of the sub graph. Analyze fraud and set rules to identify fraud tendency by developing the algorithm further [8] [9].
That contains the preceding procedures.
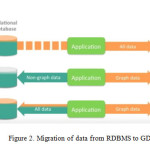
Import database from RDBMS to GDBMS
Development of nodes, feature of nodes, and connection between individuals nodes
Assortment of property to be explored and arranging together with the assistance of relationship
Traversing towards a specific node which often requires to be explored in simultaneously left as well as right way and save the relationship whenever the pattern took place.
Methods & Material
These days the measure of information is expanding step by step, so appropriately the longing for information mining is likewise developing. Substantial database must be looked to locate the fascinating properties of the graph and to build up a relationship along with them. It is gainful to demonstrate the complex data with the assistance of graph in which data is stored in nodes and edges speak to the relationship among the nodes. Subsequently having a Graph database defeats the important of relational database and helps in finding the super graph, sub graph, basic graph and connection in between different graphs [9].
This graph based data mining has turned out to be increasingly famous in the most recent couple of years. Graph mining is the utilization of most essential structure of graph to get regular patterns of data. It has board scope of applications. This procedure can be utilized to discover the possibility of persons doing wrongdoing in the organization through web or by using any other way .Some relevant researches of individuals required in digital wrongdoing were concentrated on to get the characteristics, for earning , persons required in wrongdoing, whether they are taught or not, style of wrongdoing, acquiring from the specific risk. These feature lead to the development of graph database and algorithm happens to be proposed for traversing the graph in both headings left and in addition right and build up relationship among various nodes which assist creates a sub graph as per the request[6] [9].
Neo4j is the graph database utilized for evaluation as the recovery times of graph database are not exactly social database as it takes a look at records, it doesn’t check the whole gathering to discover the nodes that met the inquiry criteria. Analysis report from this execution will likewise be useful in arranging the prevention concerning a number of offenses. The rest of this paper is sorted out as takes after.
Overview of Existing Algorithm
Existing algorithm which is used in following data discovery is as follows:
Part Miner Algorithm
gSpan Algorithm
gIndex Algorithm
RMAT Algorithm
Let’s have a brief about these algorithms:
Part Miner Algorithm
Every graph in the database is divided into littler sub graphs. Part Miner can viably diminish the quantity of candidate graphs by examining the total data of the units. This has prompted a considerable measure of cost investment funds saving. Part Miner is successful and adaptable in discovering sub graphs [5].
gSpan Algorithm
Graph-Based Substructure Pattern Mining that introduced gSpan algorithm which usually finds out regular substructures without having candidate production. gSpan develops a new lexicographic arrangement among the graphs ,and routes every graph to a exclusive minimum DFS code as the canonical label. Dependent upon this lexicographic order, gSpan explores the depth-first search approach to exploit regular connected subgraphs effectively. So, gSpan outperforms FSG by the order of degree as well as is suitable to exploit huge regular subgraphs in a larger graph arranged with lower minimal helps [9].
gIndex Algorithm
Assorted out from the established route-based techniques, this strategy, known as gIndex, will make use of regular substructure as the fundamental categorization or indexing property. Frequent substructures tend to be appropriate candidates considering that they search the internal attributes of the information as well as is reasonably steady to database upgrades [5].
RMAT Algorithm
Inside this specific recursive system for the graph mining discovering the attributes of genuine graphs which appear to continue more than several procedures. We identify such “laws” as well as, more significantly, suggest a straight forward,parsimonious method, the recursive matrix (R-MAT) system, which could rapidly produce accurate graphs, recording the importance of every single graph in a mere a couple of variables. R-MAT immediately creates graphs using the neighborhoods inside of networks property. R-MAT can conveniently come up with convincing weighted, directed and bipartite graphs [5].
Proposed Approch & Rule Set
The suggested algorithm is actually improve in overall performance than earlier algorithms such as for example gIndex , Part Miner, gSpan & RMAT when it comes to of grouping and looking around including DFSS with both left and right connection, graph property with individual dependent query and connection property.
That contains the preceding procedures.
Development of nodes, feature of nodes, and connection between individuals nodes
Assortment of property to be explored and arranging together with the assistance of relationship.
Traversing towards a specific node which often requires to be explored in simultaneously left as well as right way and save the relationship whenever the pattern took place.
Algorithm for Fraud Detection
Assumption
Fraud dataset is available
Algorithm to analyze data
Step1. Import data from database
Step2. Detect Frequency of Type of Fraud
fori ←1 to max
if type ←‘Account Fraud’
ctr←increment by one
otherwiseif type ← ‘Netbanking Fraud’
ctr2←increment by one
otherwiseif type ← ‘Siphoning’
ctr3←increment by one
otherwiseif type ← ‘Loan Fraus’
ctr4←increment by one
otherwise repeated for all the expected type
end if
end for
Step3. Calculate severity of criminal based on modus operandi
forI
end if
end for
Step3. Calculate severity of criminal based on modus operandi
for I
end if
end for
Step3. Calculate severity of criminal based on modus operandi
forI ←1to max
end if
end for
Step3. Calculate severity of criminal based on modus operandi
forI ←1to max
if ‘Mannual’ greater than 0 then
mannaul←increment by one
elseif ‘Online’ greater than 0 then
Online← increment by one
elseif ‘Offline’ greater than 0 then
Offline← increment by one
elseif ‘E-commerce’ ← greater than 0 then
Ecommerce← increment by one
elseif ‘Phishing and fraudulent e-mails’ greater than 0 then
OnlineOffline← increment by one
elseif ‘Offline/ Mannual’ greater than one then
OfflineMannualß increment by one
elseif ‘Online / Offline’ greater than one then
OnlineOffline← increment by one
otherwise
others← increment by one
end
end
Step4. Calculate severity of fraud
for i ←1to max
if cc(i)==1
case1← increment by one
Crimedata1← store record
elseif cc(i) between 1 and 2
case2← increment by one
Crimedata2← store record
elseif cc(i) between 2 and 3
case3← increment by one
Crimedata3← store record
end if
end for
Rule Set
Calculate Probability of Fraud
- Compare result with
for I ← 1 to l
if description ← similar to existing record
if modus operandi ← similar to existing record
if rank is high
prob← high probability
end if
end if
end if
end for
Step3. Calculate severity of criminal based on modus operandi
forI ←1to max
if ‘Mannual’ greater than 0 then
mannaul← increment by one
elseif ‘Online’ greater than 0 then
Online← increment by one
elseif ‘Offline’ greater than 0 then
Offline← increment by one
elseif ‘E-commerce’ ← greater than 0 then Ecommerce← increment by one
elseif ‘Phishing and fraudulent e-mails’ greater than 0 then
OnlineOffline← increment by one
elseif ‘Offline/ Mannual’ greater than one then
OfflineMannual← increment by one
elseif ‘Online / Offline’ greater than one then
OnlineOffline← increment by one
otherwise
others← increment by one
end
end
Step4. Calculate severity of fraud
for i← 1to max
if cc(i)==1
case1← increment by one
Crimedata1← store record
elseif cc(i) between 1 and 2
case2← increment by one
Crimedata2←store record
elseif cc(i) between 2 and 3
case3← increment by one
Crimedata3← store record
end if
end for
Rule Set
Calculate Probability of Fraud
- Compare result with
for I ← 1 to l
if description ← similar to existing record
if modus operandi ← similar to existing record
if rank is high
prob← high probability
end if
end if
if ‘Mannual’ greater than 0 then
mannaul← increment by one
elseif ‘Online’ greater than 0 then
Online← increment by one
elseif ‘Offline’ greater than 0 then
Offline← increment by one
elseif ‘E-commerce’ ←greater than 0 then Ecommerce← increment by one
elseif ‘Phishing and fraudulent e-mails’ greater than 0 then
OnlineOffline←increment by one
elseif ‘Offline/ Mannual’ greater than one then
OfflineMannual← increment by one
elseif ‘Online / Offline’ greater than one then
OnlineOffline← increment by one
otherwise
others← increment by one
end
end
Step4. Calculate severity of fraud
for i ← 1to max
if cc(i)==1
case1← increment by one
Crimedata1← store record
elseif cc(i) between 1 and 2
case2ß increment by one
Crimedata2ß store record
elseif cc(i) between 2 and 3
case3← increment by one
Crimedata3← store record
end if
end for
Rule Set
Calculate Probability of Fraud
- Compare result with
for I ←1 to l
if description ← similar to existing record
if modus operandi ←similar to existing record
if rank is high
prob← high probability
end if
end if
1to max
if ‘Mannual’ greater than 0 then
mannaul← increment by one
elseif ‘Online’ greater than 0 then
Online← increment by one
elseif ‘Offline’ greater than 0 then
Offline← increment by one
elseif ‘E-commerce’ ← greater than 0 then Ecommerceß increment by one
elseif ‘Phishing and fraudulent e-mails’ greater than 0 then
OnlineOffline← increment by one
elseif ‘Offline/ Mannual’ greater than one then
OfflineMannual← increment by one
elseif ‘Online / Offline’ greater than one then
OnlineOffline← increment by one
otherwise
others← increment by one
end
end
Step4. Calculate severity of fraud
for i ← 1to max
if cc(i)==1
case1←increment by one
Crimedata1← store record
elseif cc(i) between 1 and 2
case2← increment by one
Crimedata2← store record
elseif cc(i) between 2 and 3
case3← increment by one
Crimedata3←store record
end if
end for
Rule Set
Calculate Probability of Fraud
- Compare result with
for I ←1 to l
if description ←similar to existing record
if modus operandi ß similar to existing record
if rank is high
prob← high probability
end if
end if
1to max
if ‘Mannual’ greater than 0 then
mannaul← increment by one
elseif ‘Online’ greater than 0 then
Online← increment by one
elseif ‘Offline’ greater than 0 then
Offline← increment by one
elseif ‘E-commerce’ ← greater than 0 then Ecommerce← increment by one
elseif ‘Phishing and fraudulent e-mails’ greater than 0 then
OnlineOffline← increment by one
elseif ‘Offline/ Mannual’ greater than one then
OfflineMannual← increment by one
elseif ‘Online / Offline’ greater than one then
OnlineOffline←increment by one
otherwise
others← increment by one
end
end
Step4. Calculate severity of fraud
for i ←1to max
if cc(i)==1
case1←increment by one
Crimedata1← store record
elseif cc(i) between 1 and 2
case2← increment by one
Crimedata2← store record
else←if cc(i) between 2 and 3
case3 increment by one
Crimedata3←store record
end if
end for
Rule Set
Calculate Probability of Fraud
- Compare result with
for I ←1 to l
if description ← similar to existing record
if modus operandi ← similar to existing record
if rank is high
prob←high probability
end if
end if
end if
if description
end if
if description ← similar to existing record
if modus operandi ←similar to existing record
if rank middle
prob← average probability
end if
end if
end if
if description ← similar to existing record
if modus operandi ←similar to existing record
if rank is low
prob← low probability
end if
end if
end if
if description ← has no similarity to existing records
if modus operandi ← not similar to existing record
prob← No possibility of fraud
end if
end if
similar to existing record
if modus operandi ← similar to existing record
if rank middle
prob← average probability
end if
end if
end if
if description ← similar to existing record
if modus operandi← similar to existing record
if rank is low
prob← low probability
end if
end if
end if
if description ← has no similarity to existing records
if modus operandi ← not similar to existing record
prob← No possibility of fraud
end if
end if
Formula Used
Probability =
Here
- wdi – words matched in description
- WDi – total words in the description
- wmi – words matched in modus operandi
- WMi – total words in modus operandi
- ri – rank
- Ri – Max rank
- P – no of parameters taken into consideration
Optimization Of Graph
There are a few procedures to accomplish the enhancement of regular subgraphs in graph mining. Ant Colony optimization based methodology is utilized to accomplish the desired results. In this thesis we exhibit a correlation between the outcomes accomplished as far as subgraphs. The correlation is between the quantity of subgraphs recognized when a looking strategy is connected on the graph database and when the Ant Colony optimization based methodology is connected to the graph database. The pattern distinguished and the distinction regarding number of subgraphs is of awesome significance. This change is of extraordinary Importance to the application.(ACO) takes motivation from the scavenging conduct of some insect species. These ants store pheromone on the ground keeping in mind the end goal to stamp some positive way that ought to be trailed by different individuals from the colony. Ant colony optimization exploits a comparative system for taking care of optimization issues. There are a few systems to accomplish the advancement of continuous subgraphs in graph mining. Ant Colony optimization based methodology is utilized to accomplish the desired results. The comparison is anywhere between the quantities of subgraphs recognized whenever a searching strategy is practiced upon the graph database as well as whenever the ant colony dependent strategy is utilized towards the graph database. The patterns recognized plus the huge difference in terms of amount of subgraphs is actually awesome significance. This particular enhancement is of perfectly Relevance to the program. An Ant Colony Optimization algorithm (ACO) is basically a method formulated on agents which imitate the all-natural actions of ants, and this includes systems of collaboration and adjustment.
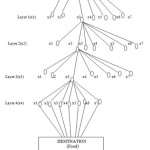
We can clarify the procedure as takes after. We accept that the ant colony has N number of ants. These ants begin going from the principal hub and after that navigate the primary layer and afterward the rest. And after that achieve the last layer and the destination hub of the diagram. This happens in each cycle or emphasis. In each cycle the ants visit stand out hub in each layer as per the state transition rule. These hubs consolidated structure a specific candidate way. For instance a way (x13, x22, x33, x42) is navigated in the diagram in (figure 1). In the start of the emphasis, all the layers are instated with equivalent measure of pheromone. So as in cycle 1, the ants begin from a hub and end at the last layer picking an arbitrary way. The procedure stops in the event that we as of now have a predetermined number of cycles or iterations. The way picked is the one with the biggest measure of pheromone. This is the ideal arrangement and every one of the ants go along the same way.
We have the method towards the issue when we move every ant bit by bit. It contains two rules:
- Local pheromone updation while the ant constructs the solution.
- Global pheromone updation when the solution is formed.
This procedure goes on until eventually the threshold value arranged is actually equivalent or increased than. This variation of ACO algorithmic rule deals along with the specific data, and also forms guidelines for the updation consequently. The data applied (Training Set) is the fraud graph database included for the evaluation. Discovered List is in which each the pruning rules is saved concerning the optimized frequent patterns.
Algorithm
TrainingSet={ all fraud cases};
DiscoveredList=[]/* initialization of the list */
WHILE(TrainingSet=max covered sets)
t=1; /* ant index*/
j=1;/* convergence test index */
all trails initialized with the same amount of pheromone
REPEAT
Ant starts with an empty set and incrementally constructs a pruning condition Pt by adding one term at a time to the current condition;
Prune condition Pt ;
Update the pheromone of all trails by increasing pheromone in the trail followed by Ant (in proportion to Pt)and decreasing pheromone in the other trails (simulating pheromone evaporation);
IF (Pt is equal to Pt– 1) /* update convergence test */
THEN j = j + 1;
ELSE j = 1;
END IF
t=t+1;
UNTIL (i ≥ No_of_ants) OR (j ≥ No_condition)
Choose the best rule R among all rules Pt constructed by all the ants;
Add rule R to DiscoveredList;
TrainingSet = TrainingSet – {set of cases correctly covered by R};
END WHILE
Results
Graph database happens to be utilized to resolve two targets. These goals are associated to the Fraud database established from previous case study for the evaluation. These objectives include:
- Graph based substructure mining for the detection of regular activities and therefore carrying out the examination
- Optimization with the sub graph utilizing the approach of Ant Colony Optimization.
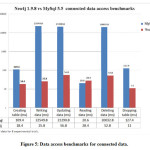
We use database entry or dataset stored in RDBMS (My SQL), by using Neo4j Lib for import data from RDBMS to Graph we generate Graph for Stored data. Graph created with this step is can be seen in Neo4j Data Browser & Neoeclipse as well [1].
The optimization of the subgraphs is obtained using the concept of Ant Colony Optimization. We again have an interface for the optimization option. The optimization of the graph database results in less number of subgraphs as compared to the normal search technique applied on the graph database. Thus first we obtain the optimized subgraphs in the Netbeans. Then this result can be seen in form of subgraphs also. The optimization is performed using two important attributes of the graph database.
We are showing both results for better understanding with & without results. That provide a wide view of fraud detection.
Results without optimization
Let’s see the result without any optimization techniques. Degree & modus opreandi (mode of operation) are both is main attributes which match for decide degree & operation of fraud by matching them to previous case studies.
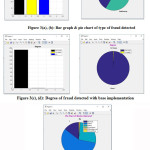
Results concluded with base implementation with graph dataset. All results which are detected are displayed with graphical presentation. (Figure 3 (a), (b), (c), (d), (e)) present results of base implementation without optimization.
Results displayed in (figure 3(a),(b)) is showing the type of fraud detected in this fraud detection in form of bar & pie chart. X axis in (figure 3(a)) showing frequency of fraud occurrence & Y axis is present degree of fraud. (figure 3(b)) showing fraud occurrence in form of pie chart.
Results with ACO Optimization:
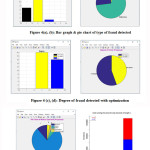
Results concluded with ACO optimization with graph dataset. We optimize dataset with All results which are detected are displayed with graphical presentation. (Figure 4(a), (b), (c), (d), (e)) present results of implementation with optimization.
All these results used degree & modus operandi ( mode of operation) with case two. Here we actually see the difference after apply proposed approach with optimized result. Results concluded with base implementation with graph dataset. All results which are detected are displayed with graphical presentation. (Figure 4 (a), (b), (c), (d), (e)) present results of implementation with optimization. Results displayed in (figure 4(a),(b)) is showing the type of fraud detected in this fraud detection in form of bar & pie chart. X axis in (figure 4(a)) showing frequency of fraud occurrence & Y axis is present degree of fraud. (figure 4(b)) showing fraud occurrence in form of pie chart.
As compare to (figure 3(c)), we can see in (figure 4(c)) that after optimization, this case present fraud rate of degree 2 & 3. This is a refine result for degree 2 & 3 in between graph data set.
Test case:
TOTAL NODE = 1400
EFFICIENCY= ((TOTAL NODES -RETRIVED NODE)/TOTAL NODES) * 100
|
S.No.
|
Retrieved DATA
|
Total nodes 1400
|
Efficiency %
|
|
1
|
Data field retrieved after searching techniques
|
406
1400- 406=994
|
71 %
|
|
2
|
Data field retrieved after optimization techniques
|
70
1400-70= 1330
|
95 %
|
Table 1: Evaluation of the proposed approach
Conclusion & Upcoming Work
Wrong doing and law breakers have been under study following for quite a while. A few methodologies are utilized to comprehend the nature and reasons of wrongdoing. This approach is another way to deal with comprehending the conduct of the crooks. This is finished by utilizing a few properties and nodes gathered from valid sources. This database, when changed over into graph database, is all the more effectively examined. The subgraphs acquired are utilized for every one of the targets of the application. Since the recovery of a subgraph is to be lessened in order to accomplish effective results, optimization is executed. The optimization is performed with the assistance of utilizing the idea of Ant Colony optimization. Change in results is likewise appeared as far as effectiveness. The subgraphs are additionally utilized for the examination of the fraud conduct utilizing Graph-based mining (gSpan). The frequent patterns are recognized utilizing standards are produced. Taking into account these principles the investigation is performed. Neo4j is utilized to get the graph creation of the database. Therefore, the goal of the exposition is accomplished and the criminal conduct is examined utilizing graph mining.
The proposed structure concentrate upon identification thievery fraud detection inside monetary systems, as well as it is able to utilize to identify plus prevent another kind of fraud in economical systems. The experimental purpose of the intelligent recognition method is created to discover fraud furthermore; it also offers an open system to work with a variety of discovery methods and techniques.
Even though the fact that the present analysis as of now performs great, it can be executed real time frameworks for locate the pattern in various type to areas like. E-commerce, network anomaly, fraud in different organization, graph based search, identity search, network IT management with little modification in pattern identification attributed we can implement this method for above mentioned area for finds any similarity in the patterns.
Acknowledgements
I am immensely indebted and owe my due regard to Dr. H. L. Mandoria, Professor, Information Technology Department, Mr. Binay Kumar Pandey, Assistant Professor, Information Technology Department, Mr. Ashok Kumar & Mr. Rajesh Shyam Singh, Assistant Professor, Information Technology Department and the members of my advisory committee for their persistent encouragement and support.
Reference
- Yan X, Han J. gSpan: graph-based substructure pattern mining. In: Technical report UIUCDCS-R-2002-2296. Champaign: Department of Computer Science, University of Illinois at Urbana; 2002.
- Yan X, Yu PS, Han J. Graph indexing: frequent structure-based approach. In: ACM SIGMOD international conference on management of data (SIGMOD’04) ACM, 2004. New York, pp. 335–46.
CrossRef
- Eichinger F, Böhm K, Huber M. Improved software fault detection with graph mining. In: Appearing in the 6th international workshop on mining and learning with graphs, Helsinki, Finland, 2008.
- Sequeda J, Arenas M, Miranker DP. On directly mapping relational databases to RDF and OWL. In WWW, pp. 49-58, 2012.
CrossRef
- Kashyap N.K., “Evaluation of Proposed Algorithm with Preceding GMT for Fraudulence Diagnosis”. Orient.J. Comp. Sci. and Technol; 9(2). Available from:http://www.computerscijournal.org/?p=3661
- Navneet Kumar Kashyap, Binay Kumar Pandey, H. L. Mandoria & Ashok Kumar,“A Comprehensive Study Of Various Kinds Of Frauds & It’s Impact”, International Journal of Computer Science Engineering and Information Technology Research (IJCSEITR) ISSN(P): 2249-6831; ISSN(E): 2249-7943 Vol. 6, Issue 3, Jun 2016, 47-58,
- Navneet Kumar Kashyap, Binay Kumar Pandey, H. L. Mandoria & Ashok Kumar, “A Review Of Leading Database: Relational & Non-Relational Database”, I-Manager’s Journal On Information Technology (JIT) ISSN (P): 2277-5110; ISSN (E): 2277-5250, (Accepted On May 31, 2016)
- Navneet Kumar Kashyap, Binay Kumar Pandey, H. L. Mandoria & Ashok Kumar, “Comprehensive Study of Different Pattern Recognition Techniques”,i-manager’s Journal on Pattern Recognition (JPR)ISSN(P): 2349-7912; ISSN(E): 2350-112X,vol. 2, No. 4, 42-49 ( Accepted on JUNE 9, 2016)
- Navneet Kumar Kashyap, Binay Kumar Pandey, H. L. Mandoria & Ashok Kumar, “GRAPH MINING USING gSpan: GRAPH BASED SUBSTRUTURE PATTERN MINING”, International Journal of Applied Research on Information Technology and Computing (IJARITAC), ISSN(P):0975-8070; ISSN(E): 0975-8089, Vol. 7, No. 2, August 2016 ,( Accepted on JUNE 13, 2016)

This work is licensed under a Creative Commons Attribution 4.0 International License.