Introduction
Data Warehouses are difficult to manufacture. Their plan requires a state of mind that is quite recently inverse to way in which conventional PC frameworks are produced. Their development requires radical rebuilding of tremendous measures of information, regularly of questionable or conflicting quality, drawn from various heterogeneous sources. Effective Data Warehouses are worked for only one reason: to answer business questions. To convey answers to specialists, one must comprehend their inquiries. The DW configuration wires business learning and innovation know-how. The outline of the information distribution center will mean the distinction amongst achievement and disappointment. The plan of the Data Warehousing requires a profound comprehension of the business. Dimensional demonstrating (DM) is the name of a legitimate outline method regularly utilized for Data Warehousing. It is not quite the same as, and appears differently in relation to, substance connection displaying (ER). This paper calls attention to the numerous contrasts between the two methods and attracts a line in the sand. DM is one of the great systems for planning databases to bolster end-client questions in a Data Warehouse. ER is exceptionally valuable for the exchange catch and the information organization periods of building an Data Warehousing, however it ought to be stayed away from for end-client conveyance.
Entity-Relationship Modeling
Database design mainly involves the design of the database schema. The entity-relationship (E-R) data model is a widely used data model for database design. ER- diagram is a graphical representation of business process to visualize data, relationships and constraints related to the business process. The model is intended primarily for the database-design process and was developed as per the enterprise schema specifications to ease out the process of database design. This type of the schema does represent the logical structure of a database. This overall structure can be expressed graphically by an E-R diagram.
An entity is an object that exists in the real world and is distinguishable from other objects. The distinctions are expressed by associations by having a set of attributes associated with an entity.
A relationship is an association among several entities. A relationship set is a collection of relationships of the same type, and an entity set is a collection of entities of the same type.
The ER modeling technique is used to clarify the relationships among data elements up to the granular level. The ER modeling removes redundancy in the data to a larger extent which is very important to improve the efficiency and effectiveness of transaction processing. The transaction of updating a customer’s address may evolve to a single record lookup in a customer address master table. This single record lookup using customer address key explains the uniqueness of the record which results in fast and efficient indexed lookup within a database. The ER modeling plays a pivotal role in the success of transaction processing in relational databases.
For a small CASE to design a database for Book-Issue and Book-Return management module of a library management system of an University will have dozens of tables linked together with mesh of joins.For any business enterprise the number of logical entities is very high and each of these logical entities are used to create physical tables while implementing the database design:
- The end-users will neither remember the design of an ER-model nor will he be able to explore through the ER-model. However, in order to explore the ER-model a GUI based interface can be useful for an end-user to navigate from one entity to the other. At present no GUI based interface for navigation is available which can be use by the end-user.
- Software based query execution on any ER-model does not give good results. However, cost-based optimizers are used for query execution but the performance decreases from bad to worst.
- Using a ER-modeling technique to improve the performance of retrieval in a Data Warehouse is actually a hybrid approach.
Ever since the beginning of the relational database revolution, the Information Systems development enterprises have been noticing this problem. Some of the Information System enterprises did make an effort to deliver data to the end-user, however, the presentation of complex schema to the end-user was a mundane task to handle. Due to the complexity of schema design, some of the enterprises started to simplify the design of schemes which is flexible and acceptable by all stakeholders.
Dimensional Modeling
The main aim of the dimensional modeling is to express business measurements in a standardized framework which will help the end-user to understand the design of business measurements easily. The Dimensional model corresponds of the information which is similar to ER model, however, the dimensional model packages the data in an uniform format with the following objectives:
- User understandability
- Query Performance
- Resilience to Change
DM is a consistent plan method that looks to display the information in a standardized form and procedure that takes into effective performance with appropriate access. Dimensional Modeling has inherited some characteristics of relational model and does holistically follow a standardized policies and procedures.
Data Warehousing is a facilitator for decision makers in a business enterprise as it helps them in gathering data; consolidating the data into meaningful information; and organizing the data & information systematically to facilitate the reporting & analysis tools like OLAP (Online Analytical Process) and various Data Mining Models. Data Warehousing tools have been inherited from relation database technology but the implementation of a database design and database design of a data warehouse varies significantly from the online analytical processing (i.e. OLAP) systems.
Table 1 : OLAP & OLTP differences
| OLTP Database |
Data warehouse database |
| Designed for real-time business transactions and processes |
Designed for analysis of business measures by subject area, category and attributes. |
| Optimized for a common and known set of transactions, usually intensive nature; addition, updations and deletion of rows at a time, per table. |
Optimized for bulk loads and large complex, unpredictable queries that access many rows per table. |
| Designed for validation of data during transactions, heavily influenced by business rules and database constraints and entity relationships. |
Designed to be loaded with consistent, valid data; uses very minimal validation routines but employs business empirical formulas for analytical purpose. |
| Stores very less historical data |
stores a hybrid of current data and historical data often regulated by the data purging and data retention strategies of the organization. |
As stated above, since the purpose of a data warehouse differs from that of an OLTP, the design characteristics of the data model that supports a data warehouse differs from the design characteristics of an OLTP data model.
An OLTP framework requires a standardized structure to limit excess, give approval of info information, and bolster a high volume of value-based information handling needs. A value-based for the most part includes business event(s, for example, putting in a request, posting a receipt installment, a credit/charge exchange and so forth. An OLTP display regularly looks like work of hundreds or thousands of tables.
Interestingly, an ordinary dimensional model uses a star or snowflake information display that is straightforward and identify with business needs, underpins rearranged business questions, and gives unrivaled information recovery prepare by limiting expansive table joins.
The central qualities of a dimensional model are an arrangement of nitty gritty business truths encompassed by different measurements that portray those realities.
Each dimensional model is made out of one table with a multipart key known as reality table and a course of action of littler tables is known as estimation tables. Every estimation table has a solitary part essential key that relates absolutely to one of the portions of the multi-part enter in the Fact-Table. This nature of “star-like” structure is otherwise called Star Join.
The main components of a Dimensional Model are Fact-Tables and Dimensional Tables
As the Fact-Table is a multipart primary key comprising of more than or equal to two foreign keys expressed by many-to-many relationship. In order to characterize each record, the Fact-Table contains one or more extra numerical measures known as “facts” that exist in the combination of keys in a record. The two important “facts” in a Fact-Table are numeric and additive. The Additivity “fact” plays an important role in retrieving a fact from a fact table record in a Data Warehouse irrespective of the size of records available in a Fact-Table. Using the additive fact in the retrieval of information helps in improving the efficiency of retrieval and increases the speed of retrieval from a Data Warehouse. In contrary to the above characteristic dimensional tables mostly contain descriptive textual information.
The Strengths of Dimensional Modeling
In comparison to ER model, the dimensional model has various important advantages and some of the advantages are given below:
- The dimensional model is an anticipated, standard system with characteristics like report writing, query tools and user interface which helps the end user to understand the database designed with ease;
- Star pattern can withstand changes in client conduct. All measurements can be thought of as symmetrically equivalent section focuses into the reality table. The consistent plan should be possible autonomous of the normal question designs;
- It is smoothly extensible to oblige new information components and new plan choices.
All existing tables can be changed by either including new information lines or by adjust table orders. Information ought not need to be reloaded.
No question or announcing ought to be reinvented to suit the change
Old applications keep on running without yielding various results.
The accompanying effortless can be made to the plan when the information distribution center is up and running:
Adding new actualities the length of they are reliable with the grain of the current certainty table
Adding new measurements, the length of there is a solitary estimation of that measurement characterized for each current actuality record
Adding new, unforeseen measurement qualities
- Standard methodologies accessible for dealing with basic displaying circumstances in the business world. Each of these circumstances has surely new set of options that can be effortlessly modified into report authors, inquiry instruments, and other UIs. These demonstrating circumstances include:
Slowly evolving measurements, where a measurement, for example, item or client develops gradually. In light of the necessities of the business condition the dimensional displaying utilizes a particular strategy to deal with the evolving measurements.
Heterogeneous items, where an efficient bank needs to track various distinctive lines of business.
Event taking care of databases, where the reality table ends up being “actuality less”
- Support for totals. Totals are outline records that are legitimately repetitive with base level information as of now in the information stockroom, however are utilized to improve question execution. In the event that you don’t total records then you may spend bunches of cash on equipment moves up to handle execution issues that could some way or another be tended to by totals. A large portion of the product apparatuses utilized for total administration depend on Dimensional model which is a critical legitimization for an end-client to choose which device can be useful.
A dimensional model can be executed in a social database, a multi-dimensional database or even a protest situated database.
The majority of the total administration programming bundles and total route utilities depend upon a specific single structure of “Fact-Table” and measurement tables that is totally dependent on dimensional model.
Snowflake and Star Schemas
In dimensional displaying the measurement tables are in de-standardized shape while certainty tables are in standardized frame. Snowflaking is expelling low cardinality (a quality not having low particular esteems to table cardinality proportion) printed properties from measurement tables and putting them in auxiliary measurement tables. For example, an item class can be dealt with along these lines and physically expelled from the low-level item measurement table by normalizing the measurement table. This is especially done on substantial measurement tables. Snowflaking a measurement implies normalizing it and making it more reasonable by decreasing its size. In any case, this may have adverse affect on execution, as joins should be performed. In the event that every one of the measurements in a star pattern are standardized, the subsequent composition is known as a snowflake schema and if just a couple measurements are standardized, we call it a star schema.
Dimensional Modeling vs. Entity Relationship Modeling
Dimensional models and conventional element/relationship (E-R) demonstrating are consistent displaying used to catch fundamental subtle elements of the model’s subject. E-R graphs more often than not speak to theoretical models, and are utilized to catch complex connections (many-to-numerous, one-to-numerous or operational connections) among substances.
The characteristics of ER Model are most likely surely knew; its ability to reinforce operational procedures is its fundamental trademark. The conventional ER models are constituted to:
- Remove repetition in the information demonstrate
- Facilitate recovery of individual records having certain basic identifiers and
- Therefore, upgrade online exchange handling (OLTP) execution
Interestingly, the dimensional model is intended to bolster the detailing and logical needs of an information distribution center framework and speaks to the accompanying attributes:
- Every relationship must be mandatory(one-to-one or one-to-numerous)
- There must be close to one conceivable way between any two entities(this averts cyclic structures)
Group of discretionary ascribes used to speak to connections, for example, stage movement, transitivity relations.
Why ER is not suitable for Data Warehouses?
- End client can’t comprehend or recollect an ER Model. End User can’t explore an ER Model. There is no graphical UI or GUI that takes a general ER outline and makes it usable by end clients.
- ER displaying is not streamlined for complex, specially appointed questions. They are streamlined for redundant tight inquiries
Utilization of ER displaying system vanquishes this principal appeal of information warehousing, to be particular regular and superior recovery of information prompts exceptionally standardized social tables.
A single ER diagram is decomposed into multiple DM diagrams which explains the relationship between dimensional modeling and entity-relationship modeling. ER diagrams representing a business process for an enterprise is complex in comparison with DM diagram where the complexity available in ER-diagram is decomposed up to granular level for increasing the understandability and helping the database designers in implementing the standards effectively and efficiently.
Therefore, the first step to convert the ER diagram to DM diagram is to decompose every single process into discrete business process and then prepare a DM diagram for all the decomposed discrete processes separately. The second step is to identify many-to-many relationships in ER diagrams which comprise of “numerics” and “additive” non-key fact. The third step will be to designate these non-key facts as Fact-Tables. The fourth step will be to de-normalize all of the remaining tables into flat tables with single-part keys that connect directly to the fact tables which are known as dimension tables. In situations where a dimensional table interfaces with more than one Fact-Table, we speak to this same dimensional table in both compositions as shared dimensions.
The subsequent master dimensional model of a data warehouse for a large business enterprise will comprise of somewhere close to ten and twenty-five fundamentally the same as “Star-Join” schemas. In the event that the outline has been done effectively, a significant number of these dimension tables will be shared from Fact-Table to Fact-Table. Applications that bore down will just be adding more dimensions ascribes to the SQL answer set from within a “Star-Join”. Applications that bore crosswise over will just be connecting separate Fact-Tables together through the shared dimensions.
Conversion of E-R Modeling to Dimensional Modeling:
We have suggested a model which will help in conversion of E-R model into dimensional model.
The model is as follows
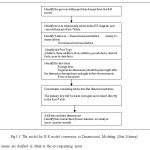 |
Figure :1.3 The model for E-R model conversion to Dimensional Modeling (Star Schema)
The means are clarified in detail in the accompanying areas.
Click here to View figure
|
Identify the business procedure from the E/R display
Understand that an E/R model can be divided into numerous dimensional models. An E/R display (which might be a venture information distribution center or an OLTP source framework) comprises of a few business forms. For instance, an E/R show for an ERP framework incorporates a few business procedures, for example, retail deals, arrange administration, acquisition, stock, and store and distribution center stock administration.
Identify many-to-many tables in E/R show
Once the business procedures are isolated, the following stage is to recognize the many-to-many tables (many-to-numerous connections) in the E/R model and change over them to dimensional model reality tables. These many-to-numerous connections contain numeric and added substance non-key realities which by and large move toward becoming truths inside the reality table. The thought behind this progression is to distinguish the exchange based tables that serve to express many-to-numerous connections inside an E/R demonstrate. Each E/R show comprises of exchange based tables which always have information embedded, or are refreshed with information, or have information erased from them. Some of these tables likewise express a many-to-numerous relationship. For instance, in an ERP database, there are exchange tables, for example, Invoice and Invoice_Details, which are always embedded and refreshed on the grounds that they are exchange based tables. Notwithstanding, tables, for example, Employee and Products in an E/R model might be genuinely static.
Reality tables in a dimensional model express the many-to-numerous connections between measurements. This implies the outside keys in the reality tables share a many-to-numerous relationship. The many-to-many tables in the E/R model are for the most part the exchange situated tables.
De-normalize residual tables into level measurement tables
The last stride includes taking the rest of the tables in the E/R demonstrate and de-normalizing them into measurement tables for the dimensional model. The essential key of each of the measurements is made a surrogate (non-insightful, whole number) key. This surrogate key interfaces straightforwardly to the reality table. For instance the table given beneath will help in better understanding:
Identify date and time dimension from E/R model
The last step generally involves identifying the date and time dimension. Dates are generally stored in the form of a date timestamp column inside the E/R model. Mostly date and time-related columns are generally found in the transaction-based tables.
A date dimension typically represents day, week, month, quarter, or year, where a time dimension represents hours, minutes and seconds within a day.
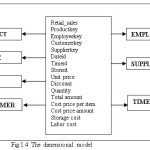
Eg of Time dimension table:
Timeid, year, Quarter name, Quarterno, Monthname, monthno, dayofmonth, dayname, dayofweek etc. can be the attributes of time dimension table. The final dimensional model is shown in figure 1.4
Use of DMQL
Just as relational query language like SQL can be used to specify relational queries, a data mining query language can be used to specify data mining tasks.
In particular, we examine how to define data warehouses I our SQL-based data mining query language, DMQL.
The Cube definition statement has the following syntax:
Define cube (cube-name) [(dimension-list): (measure-list)]
The Dimension definition statement has the following syntax:
Define dimension (dimension_name) as ((attribute-or-dimension-list))
Example how to create a fact table and a dimensional table:
Define cube retail_sale[ product, store, customer]
Define dimension product as (productid, productname, supplierid, categoryid, productcode, productcount, branded)
Define dimension store as (storied, store_code, store_name, store_region_name, store_country, store_state, store_type)
Define dimension customer as (customerid, customer_type, customer_type_description, customer_territory_description, customer_shopper_id, customer_full_name, customer_last_name, address, city, region, postalcode, country, phone, fax);
Identifying the Grain and its importance
The most minimal level of information spoken to in a reality table is characterized as grain. A solitary business process may comprise of more than one dimensional model. Try not to drive fit the diverse actualities and measurements which have a place with various dimensional models into a solitary star schema.
When to create separate fact tables
When planning the dimensional model for a business procedure, at least one certainty tables can be made. Here are rules to consider when choosing to make at least one actuality tables for planning the dimensional model for the business procedure:
- Facts that are not valid (legitimate) to any given grain ought not be constrained into the dimensional model. Regularly actualities that are not consistent with a grain definition have a place with a different reality table with its own particular grain definition.
- Dimensions that are not valid (substantial) to any given grain ought not be constrained into the dimensional model. Frequently such measurements have a place with a different dimensional model with its own reality table and grain.
- Separate truth tables (dimensional models) ought to dependably be made for every one of a kind business prepare.
In the event that the dimensional model is planned with a more elevated amount grain (which means it is exceptionally collected and along these lines contains less point by point information), there will be less measurements accessible for use to perform detailed investigations. There are three sorts of actuality tables and are as given below:
- Transaction fact table
- Periodic fact table
- Accumulating fact table
The motivation to demonstrate distinctive sorts of actuality tables is to stress that each ordinarily has diverse sorts of grain related with it. It is essential that the architect know about these reality table sorts so that the creator can utilize the most fitting kind of the fact tables.
Transaction fact table
An exchange based Fact-Table is a table that records one tuple for each exchange. A portion of the critical characteristics about the exchange Fact-Table are given beneath:
A single tuple is inserted for each exchange.
Typically, the date and time measurements are communicated and no more insignificant level, for example, the date estimation may be communicated at the day level and the time estimation may be communicated at the hour or moment level.
The Fact-Table exchanges are alluded to end up plainly speedy as the amount of exchanges augmentations.
Periodic fact table
An intermittent actuality table stores one line for a gathering of exchanges made over a timeframe. Critical components of the intermittent fact table are:
- A single column is embedded for each arrangement of exercises over a timeframe.
- Typically, the date and time measurements are spoken to at the more elevated amount of detail. For instance, the date measurement might be spoken to at the month level (rather than day) and the time measurement might be spoken to at the hour level (rather than seconds or minutes).
- The occasional reality table is known to develop nearly gradually in contrast with the exchange actuality table.
Accumulating fact table
An amassing fact table stores one line for the whole lifetime of an occasion. One column for the whole lifetime of an occasion. For instance, the lifetime of a credit-card application being sent to the time it is acknowledged. This sort of actuality table includes numerous date dimensions to demonstrate the accomplishment of various points of reference.
Conclusions
Most PC frameworks are intended to gather data, however, data warehouses are responsible for retrieving information based on the requirements of the end-user as and when required. The difference between the data gathering process and data warehousing are different in functionality as well as objectivity. Therfore, the tools and techniques used for both the process need to be designed based on the requirements and the objectivity. Dimensional modeling is a technique used in Data warehousing while as ER diagrams is specifically used in designing databases irrespective of size and changing requirements of business enterprises. Therefore, the need of the hour is to have different set of tools and techniques for Data warehousing and database design form enterprise business processes.
Dimensional modeling is one of the popular and effective techniques used in Data Warehousing and similarly ER diagrams technique has been very effective technique in expressing business processes graphically which makes Dimensional modeling a suitable technique for OLAP while as ER diagrams a suitable technique for OLTP systems. However, the need of the hour is to find methods and means to convert the ER diagram results into dimensional model which will help the developers in utilizing the resources of Data warehousing in general and management of mammoth size of data in particular.
References
- Singh, Y. and Kumar, P., “A software reliability growth model for three-tier client-server system”, International Journal of Computer Applications, Vol. 1, No. 13, pp. 9-16, 2010, doi:10.5120/289-451
CrossRef
- Singh, Y. and Kumar, P., “Determination of software release instant of three-tier client server software system”, International Journal of Software Engineering, Vol. 1, No. 3, pp. 51-62, 2010.
CrossRef
- Singh, Y. and Kumar, P., “Application of feed-forward networks for software reliability prediction”, ACM SIGSOFT Software Engineering Notes, Vol. 35, No. 5, September 2010, pp. 1-6. doi:10.1145/1838687.1838709
CrossRef
- Singh, Y. and Kumar, P., “Prediction of Software Reliability using Feed Forward Neural Networks”, Proceedings of Computational Intelligence and Software Engineering (CiSE), 2010 International Conference, 2010, Wuhan, China, doi:10.1109/CISE.2010.5677251
- Kirmani, M., & Wahid, A., “Revised Use Case Point (Re-UCP) Model for Software Effort Estimation”, International Journal of Advanced Computer Science and Applications IJACSA, Vol. 6, No. 3, 65-71. doi:10.14569/issn.2156-5570.
CrossRef
- Kirmani, M., & Wahid, A., “Use Case Point and e-Use Case Point method of software effort estimation: A critical performance comparison”, IJCA, Vol. 5, No. 3, 2015, pp. 55-64.
- Kirmani, M., Wahid, A., & Saif, S., “Web Engineering: An Engineering Approach for Developing Web Applications”, International Journal of Software and Web Sciences, Vol. 1, No. 12, 2015, pp. 83-91.
- Kirmani, M., Mohsin, S., & Wahid, A., “Re-UCP Software Effort Estimation Method: A Critical Study” International Journal of Computer Applications IJCA, Vol. 127, No. 11, 2015, pp. 8-12, doi:10.5120/ijca2015906534.
CrossRef
- R. Kimball & M Ross, “The Data Warehouse Toolkit”, 2e, John Wiley, 2002.
- J.M. Firestone, “Dimensional modeling and ER modeling in the Data Warehouse”, http://www.dkms.com/DMERDW.html
- N Raden, “Modeling the Data Warehouse”, http://members.aol.com/nraden
- R. Kimball, “A dimensional Modeling Manifesto”, http://www.dbmsmag.com/9708d15.html
- Ralph Kimball, The Data Warehouse Toolkit: Practical Techniques for Building Dimensional Data Warehouses, , John Wiley, 1996.
- Eric Thomsen, OLAP Solutions: Building Multidimensional Information Systems, John Wiley, 1997.
- Vidette Poe, Building a Data Warehouse for Decision Support, Prentice Hall, 1995.
- Kenan Technologies: An Introduction to Multidimensional Database Technology, White Paper, Kenan Technologies, 1995.
- Ralph Kimbel, “A dimensional modelling manifesto-Drawing the line between dimensional modelling and ER modelling technique” .
- Ballard, C. et. al. “Dimensional Modelling in business environment”, IBM red books, March 2006.
- Boehnlein, M and Ende, A. U., “Deriving initial data warehousing structures from the conceptual data models of the underlying operational information system”, Proceedings of the 2nd ACM International workshop on Data Warehousing and OLAP, DOLAP 99, pp. 15-21, doi:10.1145/319757.319780
CrossRef
- Srivastava, J., and Chen, P. Y., “Warehouse creation-A potential roadblock to data warehousing”, Vol. 11, No. 1, IEEE transaction on knowledge and data engineering.

This work is licensed under a Creative Commons Attribution-NonCommercial-ShareAlike 3.0 International License.

This work is licensed under a Creative Commons Attribution 4.0 International License.