Introduction
In India, very little is known about the Agile methodology and software companies need (out of Agile or heavyweight). Due to the lack of any survey, vendors as well as companies are facing problems regarding adaptation of an appropriate Agile methodology. Survey goal was not only to gain understanding of features but also to collect statistics about usage and needs desired by companies. The software market is becoming more dynamic which can be easily seen from frequent changes in the needs of customer. Requirements are to respond quickly these changes. For software companies this means that they have to become Agile with the objective of developing features like very short lead-time and high quality.
Dynamically changing environment makes requirement to change in the software development process an inevitable task. Poor requirements and changes to requirements are two major elements that cause software project failures [1]. To cope up with this, Agile is trying to meet the demands of customers. Agile is defined as
An iterative and incremental (evolutionary) approach to software development which is performed in a highly collaborative manner by self-organizing teams within an effective governance framework with “just enough” ceremony that produces high quality solutions in a cost effective and timely manner which meets the changing needs of its stakeholders [2].
|
|
A1
|
A2
|
A3
|
A4
|
A5
|
|
XP
|
0
|
2
|
0
|
0
|
3
|
|
Scrum
|
1
|
1
|
2
|
9
|
12
|
|
DSDM
|
0
|
0
|
1
|
0
|
1
|
|
FDD
|
0
|
1
|
1
|
0
|
2
|
|
Lean
|
0
|
0
|
0
|
2
|
5
|
|
Others
|
3
|
2
|
7
|
8
|
0
|
Table Annex 1.1 Frequency and Agile methodology
To calculate the F-ratio
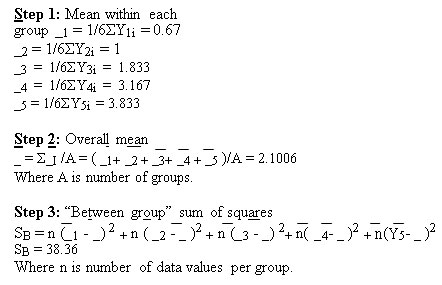
The between-group degrees of freedom are one less than the number of groups. f b = 5-1 = 4
MSB = 38.36/4 = 9.59 (So the between group mean square value)
Step 4: “Within – group” sum of squares.
|
A1
|
A2
|
A3
|
A4
|
A5
|
|
0-0.67= –
|
2-1=1
|
0-1.833= –
|
0-3.167=-
|
3-3.833=-
|
|
0.67
|
|
1.833
|
3.167
|
0.833
|
|
1-0.67=
|
1-1=0
|
2-
|
9-
|
12-
|
|
0.33
|
|
833=0
|
3.167=5.8
|
3.833=8.167
|
|
|
|
.167
|
33
|
|
|
0-0.67= –
|
0-1=-1
|
1-1.833=-
|
0-3.167=-
|
1-3.833=-
|
|
0.67
|
|
0.833
|
3.167
|
2.833
|
|
0-0.67= –
|
1-1=0
|
1-1.833=-
|
0-3.167=-
|
2-3.833=-
|
|
0.67
|
|
0.833
|
3.167
|
1.833
|
|
0-0.67= –
|
0-1=-1
|
0-1.833=-
|
2-
|
5-
|
|
0.67
|
|
1.833
|
3.167=1.1
|
3.833=2.833
|
|
|
|
|
67
|
|
|
3-0.67=
|
2-1=1
|
7-
|
8-
|
0-3.833=-
|
|
2.33
|
|
1.833=5.167
|
3.167=4.8
|
3.833
|
|
|
|
|
33
|
|
Table Annex 1.2 Within Group Analysis
Within-group sum of squares is the sum of squares of all 30 values in this table.
S w = (-0.67)2 + (0.33)2 + (-0.67)2 + (-0.67) 2 + (-0.67)2 + (2.33)2 + (1)2 + (0)2 + (-1)2 + (0) 2 + (-1)2 + (1)2 + (-1.833)2 + (0.167)2 + (-0.833)2 + (-0.833)2 + (-1.833)2 + (5.167)2 + (-3.167)2 + (5.833)2 + (-3.167)2 + (-3.167)2 + (1.167)2 + (4.833)2 + (-0.833)2 + (8.167)2 + (-2.833)2 + (-1.833)2 + (2.833)2 + (-3.833)2 =236.4983
MSw = S w/ f w = 236.4983/25 = 9.46
Step 5: F-ratio is
F= MSB / MSw = 1.013
Fcrit (4,25) = 2.758 at α = 0.05
Taking hypothesis “Quality get increases on using different methodology of Agile instead of heavyweight methods”.
|
|
A1
|
A2
|
A3
|
A4
|
A5
|
|
XP
|
0
|
2
|
0
|
1
|
2
|
|
Scrum
|
2
|
1
|
1
|
8
|
13
|
|
DSDM
|
0
|
0
|
1
|
0
|
1
|
|
FDD
|
0
|
0
|
1
|
3
|
0
|
|
Lean
|
0
|
0
|
0
|
2
|
4
|
|
Others
|
5
|
4
|
4
|
7
|
0
|
Table Annex 2.1
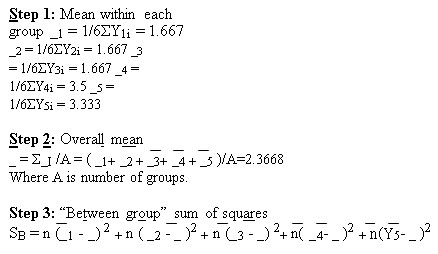
SB = 9.65635
Where n is number of data values per group.
The between-group degrees of freedom are one less than the number of groups. f b = 5-1=4
so the between group mean square value is MSB = 9.65635/4= 2.414
Step 4: “Within- group” sum of squares
|
A1
|
A2
|
A3
|
A4
|
A5
|
|
0-1.667= -1.667
|
2-1.667= 0.333
|
0-1.667= -1.667
|
1-3.5= –
|
2-3.333= –
|
|
|
|
|
2.5
|
1.333
|
|
2-1.667= 0.333
|
1-1.667= -0.667
|
1-1.667= 0.667
|
8-3.5=
|
13-3.333=
|
|
|
|
|
4.5
|
9.667
|
|
0-1.667= -1.667
|
0-1.667= -1.667
|
1-1.667= 0.667
|
0-3.5= –
|
1-3.333= –
|
|
|
|
|
3.5
|
2.333
|
|
0-1.667= -1.667
|
0-1.667= -1.667
|
1-1.667= 0.667
|
3-3.5=
|
0-3.333= –
|
|
|
|
|
0.5
|
3.333
|
|
0-1.667= -1.667
|
0-1.667= -1.667
|
0-1.667= -1.667
|
2-3.5= –
|
4-3.333=
|
|
|
|
|
1.5
|
0.667
|
|
5-1.667= 3.333
|
4-1.667= 3.333
|
4-1.667= 3.333
|
7-3.5=
|
0-3.333=-
|
|
|
|
|
2.5
|
3.333
|
Table Annex 2.2
Within-group sum of squares is the sum of squares of all 30 values in this table.
S w = (-1.667)2 + (0.333)2 + (-1.667)2 + (-1.667)2 + (-1.667)2 + (3.333)2 + (0.333)2 + (-0.667)2 + (-1.667)2 + (-1.667)2 + (-1.667)2 + (3.333) 2 + (-1.667)2 + (0.667)2 + (-0.667)2 + (0.667)2 + (-1.667)2 + (3.333)2 + (-2.5)2 + (4.5)2 + (-3.5)2 + (0.5)2 + (1.5)2 + (2.5)2 + (1.333)2 + (9.667)2 + (2.333)2 + (3.333)2 + (0.667)2 + (3.333)2 =248.3893
MSw = S w/ f w = 248.3893/25 = 9.935
Step 5: F-ratio is
F= MSB / MSw = 2.414/9.935 =0.2429 Fcrit (4, 25) = 2.758 at α = 0.05
Taking Hypothesis “Cost reduces on using different methodology of Agile instead of heavyweight methods”.
It can be proved as follows:
|
|
|
A1
|
A2
|
A3
|
|
A4
|
A5
|
|
XP
|
|
2
|
2
|
0
|
|
1
|
0
|
|
Scrum
|
|
14
|
2
|
0
|
|
1
|
3
|
|
DSDM
|
|
0
|
7
|
1
|
|
0
|
0
|
|
FDD
|
|
1
|
1
|
1
|
|
1
|
0
|
|
Lean
|
|
5
|
1
|
0
|
|
0
|
1
|
|
Others
|
|
2
|
10
|
7
|
|
0
|
0
|
Table Annex 3.1
To calculate F-ratio
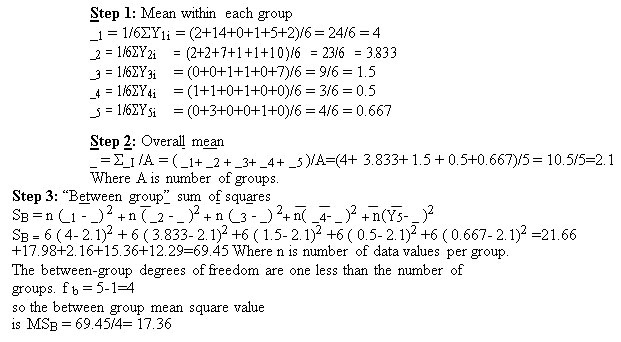
Step 4: “Within- group” sum of squares.
|
A1
|
A2
|
A3
|
A4
|
A5
|
|
2-4 = -2
|
2-3.833 =
|
0-1.5 = -1.5
|
1-0.5 =
|
0-0.667
|
|
|
1.833
|
|
0.5
|
= -0.667
|
|
14-4 = 10
|
2-3.833 =
|
0-1.5 = -1.5
|
1-0.5 =
|
3-0.667
|
|
|
1.833
|
|
0.5
|
= 2.33
|
|
0-4 = -4
|
7-3.833 =
|
1-1.5 = 0.5
|
0-0.5 =
|
0-0.667=
|
|
|
4.17
|
|
-0.5
|
-0.667
|
|
1-4 = -3
|
1-3.833 = –
|
1-1.5 = 0.5
|
1-0.5 =
|
0-
|
|
|
2.833
|
|
0.5
|
0.667=-
|
|
|
|
|
|
0.667
|
|
5-4 = 1
|
1-3.833 = –
|
0-1.5 = -1.5
|
0-0.5 =
|
1-
|
|
|
2.833
|
|
-0.5
|
0.667=-
|
|
|
|
|
|
0.667
|
|
2-4 = -2
|
10-3.833 =
|
7-1.5 = 5.5
|
0-0.5 =
|
0-0.667=
|
|
|
6.17
|
|
-0.5
|
-0.667
|
Table Annex 3.2
The within-group sum of squares is the sum of squares of all 30 values in this table.
S w = (-1.667)2 + (0.333)2 + (-1.667)2 + (-1.667)2 + (-1.667)2 + (3.333)2 + (0.333)2 + (-0.667)2 + (-1.667)2 + (-1.667)2 + (-1.667)2 + (3.333) 2 + (-1.667)2 + (0.667)2 + (-0.667)2 + (0.667)2 + (-1.667)2 + (3.333)2 + (-2.5)2 + (4.5)2 + (-3.5)2 + (0.5)2 + (1.5)2 + (2.5)2 + (1.333)2 + (9.667)2 + (2.333)2 + (3.333)2 + (0.667)2 + (3.333)2 =2.7789 + 0.1108 + 2.7789 + 2.7789 + 2.7789 + 11.1089 + 0.1108+ 0.4449 + 2.7789 + 2.7789 + 2.7789 + 11.1089 + 2.7789+ 0.4449 + 0.4449+
0.4449 + 2.7789 + 11.108 + 6.25 + 20.25 + 12.25 + 0.25 + 2.25 + 6.25 + 1.7769 + 93.45 + 5.442 + 11.108 + 0.4449 + 11.108 = 11.2264+17.2224+17.5565+40.8318+22.7769+121.5529 =248.3893
MSw = S w/ f w = 248.3893/25 = 9.935
Step 5
The F-ratio is
F= MSB / MSw = 17.36 / 9.935 = 1.747 Fcrit (4,25) = 2.758 at α = 0.05
Annexure II
Table 1: Effectiveness of Agile in Case of Productivity
|
How Effective Agile Methods are in
|
Frequency
|
|
Case of Productivity
|
|
|
Much Lower
|
4
|
|
Somewhat Lower
|
7
|
|
No Change
|
10
|
|
Somewhat Higher
|
20
|
|
Much Higher
|
25
|
Related Work In Agile
Due to constant changes in the technology and business environments, it is a challenge for heavyweight software development methods to create a complete set of requirements up front [3]. Recently, more attention has been paid to agility because of the constant change in requirements and to produce cost effective software.
Agile methodology began its journey in the mid-1990s, when software methodology and techniques such as Extreme Programming [4], Scrum [5], Crystal Family of Methodology [6], Dynamic Systems Development Method (DSDM) [7], Adaptive Software Development (ASD) [8], and Feature-Driven Development (FDD) [9] began to emerge.
Table 2: Effectiveness of Agile in Case of Quality
|
How Effective Agile Methods are in
|
Frequency
|
|
Case of Quality
|
|
|
Much Lower
|
7
|
|
Somewhat Lower
|
8
|
|
No Change
|
7
|
|
Somewhat Higher
|
21
|
|
Much Higher
|
22
|
Table 3: Effectiveness of Agile in Case of Cost of System Development
|
How Effective Agile Methods are in
|
Frequency
|
|
Case of Cost of System
|
|
|
Development
|
|
|
Much Lower
|
26
|
|
Somewhat Lower
|
23
|
|
No Change
|
9
|
|
Somewhat Higher
|
3
|
|
Much Higher
|
4
|
T. Dyba, & T. Dingsoyr summarizes the differences between Agile development and heavyweight development on the basis of an unpredictable world, as well as emphasizes the value competent people and their relationships to software development [10].
A model for integrating Scrum and XP was proposed by Zaigham Mushtaq in 2012 for good project management paradigm and to produce quality software product that is aligned with customer requirements and company objectives [11]. But this model is not tested using industrial environments.
According to Boehm and Turner, Carlton, Hakan et al. consider their model a useful starting point for generating hypothesis for future research, which could lead to generalize and actionable recommendation for scientific software development community. According to them Agile is well suited for exploratory, iterative and collaborative but Agile methodology might not be applicable in all situations pertaining to scientific software development projects [12].
Brief Overview of Heavyweight Methods and Agile
Heavyweight methods are also known as traditional methods. These are based on a series of steps, such as requirement analysis, coding, testing, deployment and maintenance of project. Heavyweight methodology is focused on planning everything from the start of a project. These are very documentation centric. To cope with current market needs and to save cost and time, Agile methods are being adopted by companies.
Agile started its journey when 17 representatives of different Agile method experts, met at Utah and formulated Agile manifesto [13] which consists of 12 principles and 4 values. In Agile software development, processes do not follow defined steps, but uses very short iterations of about 2-4 weeks which focus on producing working software rather than heavy documentation. Agile also allows requirements to emerge throughout the development process and it allows changes to requirements even late into the project with minimum impact on software functionality and quality of the delivered product. It has the properties like iterative development (consisting of short iterations), working versions (at completion of each iteration), fully integrated, tested, adaptable and people-centric methodology.
Results
Based on the web based survey, questionnaire and interview, following results are obtained. The survey covers 70 responses through mentioned modes. Online survey was available at http://www.surveyact.com/s/Szjtjuw1AZ5DJuii in month of June to August 2013. In India, it is found that 65.71% people are using Agile software development methods. Agile is more preferred technology than heavyweight methodology. Organizations prefer Agile for small scale projects while prefer heavyweight methodology for large scale projects [14].
Hypothesis Designing and proof
Following Hypothesis are designed and proved using F-test and one way ANOVA method. Values obtained by researcher are displayed using frequency tables (Annexure II). Analysis is done on the data obtained by researcher by different modes such as questionnaire , interview and web based survey.Table 1, Table 2 and Table 3 are constructed accordingly.
Hypothesis I
Production increases on using different methodology of Agile instead of heavyweight methods.
Proof
Researcher obtained 1.013 < 2.758 in case of production where 1.013 is calculated value and 2.758 is table value. The results areinsignificant at the 5% significance level. There is no evidence that expected values in five groups differ.
The calculated value of F is less than the table value which means value is insignificant and hypothesis is accepted. In above case the calculated value of the F (1.013) is less than the table value (2.758) hence it is insignificant at 5% level of significance and Hypothesis is accepted (Annexure I).
Hypothesis II
Quality increases on using different methodology of Agile instead of heavyweight methods.
Proof
Researcher obtained 0.2429 < 2.758, where 0.2429 is calculated value and 2.758 is table value. The results are insignificant at the 5%significance level. There is no evidence that expected values in five groups differ.
So, the calculated value of F is less than the table value which means value is insignificant and hypothesis is accepted. In above case the calculated value of the F (0.2429) is less than the table value (2.758) hence it is insignificant at 5% level of significance and Hypothesis is accepted (Annexure I).
Hypothesis III
Cost reduces on using different methodology of Agile instead of heavyweight methods.
Proof
Researcher obtained 1.747 < 2.758 where 1.747 is calculated value and 2.758 is table value. The results are insignificant at the 5%significance level. There is no evidence that expected values in five groups differ.
So, the calculated value of F is less than the table value which means value is insignificant and hypothesis is accepted. In above case the calculated value of the F (1.747) is less than the table value (2.758) hence it is insignificant at 5% level of significance and hypothesis is accepted (Annexure I).
So, according to findings it has been observed that quality and production increases on using Agile and cost decreases on using Agile (Annexure I).
Conclusion
In this paper, the results of survey on Agile methodology in Indian organizations are presented. In heavyweight software development methodology, lack of user input, incomplete requirements, and changing requirements are some of the major reasons for not to deliver all planned functionality on schedule and within budget.
An interesting fact that is noticed is that companies mostly developing small projects are enjoying a good amount success in using Agile methods. It is also observed that the companies are not really being encouraged in terms of using a variety of Agile methods [14]. This is because of lack of sound proficiency in this field. It is therefore important that empirical research and investigation should be carried out in this field. It can be
understood that Agile methods are highly practical oriented and application of different practices of Agile methodology differ from company to company.
One Way Anova Calculations
Taking Hypothesis “Production increases on using different methodology of Agile instead of heavyweight methods”.
This can be proved by taking one-way ANOVA. The frequency table can be constructed as below:
References
- E. O. Oyeyipo, An empirical study of requirements management in an agile-scrum development environment, Dissertation, 2011, pp. x, xi
- http://www.agilemodeling.com/essays/agile Software Development .htm
- Parikshit Joshi,Ashish Aggarwal and Shivani Goel. 2013.Communication issues in agile methodology: A Surver. IJLRST,VOL 2(ISSUE 4), PAGE 15-20
- K. Beck, & C. Andres, Extreme Programming Explained: Embrace Change. Second Edition. Addison-Wesley. Boston, 2004, pp. 189.
- K. Schwaber, Agile Project Management with Scrum. Microsoft Press, Washington, 2004, pp. 163.
- A. Cockburn, Surviving Object-Oriented Projects, Addison-Wesley, Reading Mass, 1998, pp. 250.
- J. Stapleton, DSDM: Business Focused Development. Second Edition. Addison Wesley, London, 2003, pp. 239.
- J. A. Highsmith, Adaptive Software Development: A Collaborative Approach to Managing Complex Systems, New York: Dorset House, 2000, ISBN 0-932633- 40-4, pp. 392.
- P. Coad, E. LeFebvre & J. De Luca, Java Modeling In Color With UML: Enterprise Components and Process, Prentice Hall,1999, pp. 221.
- T. Dyba, & T. Dingsoyr, What do we know about agile software development?. Software, IEEE, 26(5), 2009, pp. 6-9.
CrossRef
- Z. Mushtaq, & M.R.J. Qureshi, Novel hybrid model:Integrating Scrum and XP, I.J. Information Technology and Computer Science(IJITCS), June 2012, issue VI, pp 39-44
- C. A. Crabtree, A. G. Koru, C. Seamon, & H. Erdogmus, An Empirical Characterization of Scientific Software Development Projects According to the Boehm and Turner Model: a Progress Report, SECSE’09, ICSE’ 09 workshop, 23 May 2009, Vancouver, Canada.
- http://www.agilemanifesto.org/
- U. Kumari, Agile survey: Indian organizations, International Journal of Engineering Research and Technology,Vol2(issue 12) (IJERT), pp. 1450-1454

This work is licensed under a Creative Commons Attribution 4.0 International License.