Improving E-Learning Support and Infrastructure in Different Districts of Jammu and Kashmir
Introduction
In today’s life scenario technology is so advance you can be taught something anywhere, anytime by way of E-learning. Some corporations have monetary crisis, they don’t effort gigantic no of trainers in order that they use e-studying which is fascinating and get monetary savings, trainee also enjoys. In schooling sector more than a few universities provides degree through e-learning. Students are get enrolled in various guides, they study through e-learning methods and the supply their examination online .They don’t need to attend ordinary school room, it’s good for these student who are working and don’t have time to move study room.E-learning has emerged as a necessity to fulfill the challenges posed through the development of expertise technology and its advantage for bigger access to knowledge [1]. E-learning was once first presented in developed countries; for this reason, the adoption and utilization units developed there have been taken as benchmarks global. Almost, the influential explanations and boundaries to the adoption of e-learning inside one of a kind societies and vicinity may just or is probably not the identical as for those recognized in developed areas, with various levels of depth or significance [2]. As a result, the units on hand for adoption might not be utilized across all steps and phases when utilized via one of a kind societies and nations. As such, influential motives and obstacles to e-learning could vary between instances. In regard to academic enterprises throughout the globe, e- learning is becoming more largely adopted. As with many extraordinary nations, the adoption of e-studying in the context of higher educational institutions has become the area of much research and examination. Importantly, regardless of the high necessities of residing inside the country, With this noted, it is most important that organizations and the government work collectively to be able to replace and upgrade the talents of their topics, whether or not workers, customers or scholars, and to additional supply on- going studying and coaching the place e-studying continues to be to play a key role [3].
E-Learning refers to ‘‘using new multimedia applied sciences and the web to fortify the quality of studying via facilitating entry to assets and offerings as good as far flung exchanges and collaboration’’. E-learning can take position completely online in digital environments or in a mix of virtual and face-to-face environments; a mode entitled ‘blended finding out’. E-finding out has the capabilities to influence positively on education. It provides great opportunities for both educators and newcomers to enrich their academic experiences (Holmes and Gardner,2006)[4]. The new advancement in communication and information technologies has made an impact on some aspects of today’s societies. Largely, commerce, politics and education have been undeniably influenced (Garrison and Anderson, 2003; Khan, 2005) [5][6]. Terms like the global village, information society and knowledge society symbolize the new realties and change in modern societies. Education facilitated by the new ICT or e-learning is transforming learning and instruction forms (Garrison and Anderson, 2003) in ways ‘‘that extend beyond the efficient delivery or entertainment value of traditional approaches’’ (Garrison and Anderson, 2003, p. 2)[5].
As we can see E-learning is successful all around the world but how? Attempts to address this question have resulted in a large volume of anecdotal studies assessing the success of e-learning initiatives on various measures such as learning benchmarks (Pittinsky & Chase, 2000)[7], learning styles (Byrne, 2002)[8], learning environment (Jung et al., 2002)[9], learning outcomes (McClelland, 2001; Motiwallo & Tello, 2000; Teh, 1999)[10][11], teaching practices (Savenye, et al., 2001; Owston & Wideman, 1998)[12][13] and cost-benefits (Smith, 2001; Lawhead et al., 1997)[14][15]. Some of these studies are guidelines or “best practices” of e-learning that are developed from case studies[8][14][7][15] (Byrne, 2002; Smith, 2001; Pittinsky & Chase, 2000; Lawhead et al., 1997). The most comprehensive guidelines are Pittinsky & Chase’s 24 benchmarks in seven areas: institutional support, course development, teaching/learning, course structure, student support, faculty support, and evaluation and assessment (Pittinsky & Chase, 2000)[7]. The rest of the studies attempted to explore a variety of factors and intervening variables that might have an impact on the success of e-learning. As a result, it is difficult to understand and isolate success factors of e-learning as there is a lack of consensus of what constitutes success of e-learning.
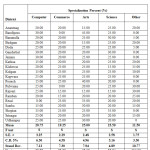
Table 1: Distribution according to specialization in different districts of Jammu & Kashmir.
|
District
|
Specialization Percent (%)
|
|
Computer
|
Commerce
|
Arts
|
Science
|
Other
|
|
Anantnag
|
20.00
|
15.00
|
25.00
|
20.00
|
20.00
|
|
Bandipora
|
20.00
|
20.00
|
20.00
|
25.00
|
15.00
|
|
Baramulla
|
25.00
|
15.00
|
20.00
|
20.00
|
20.00
|
|
Budgam
|
25.00
|
15.00
|
20.00
|
25.00
|
15.00
|
|
Doda
|
10.00
|
20.00
|
30.00
|
20.00
|
20.00
|
|
Ganderbal
|
15.00
|
20.00
|
25.00
|
20.00
|
20.00
|
|
Jammu
|
30.00
|
20.00
|
15.00
|
20.00
|
15.00
|
|
Kathua
|
15.00
|
20.00
|
25.00
|
20.00
|
20.00
|
|
Kishtwar
|
10.00
|
20.00
|
20.00
|
30.00
|
20.00
|
|
Kulgam
|
20.00
|
15.00
|
20.00
|
25.00
|
20.00
|
|
Kupwara
|
25.00
|
20.00
|
20.00
|
20.00
|
15.00
|
|
Poonch
|
20.00
|
20.00
|
20.00
|
25.00
|
15.00
|
|
Pulwama
|
25.00
|
15.00
|
25.00
|
15.00
|
20.00
|
|
Rajouri
|
30.00
|
10.00
|
20.00
|
25.00
|
15.00
|
|
Ramban
|
15.00
|
20.00
|
25.00
|
20.00
|
20.00
|
|
Reasi
|
25.00
|
15.00
|
20.00
|
20.00
|
20.00
|
|
Samba
|
20.00
|
15.00
|
25.00
|
25.00
|
15.00
|
|
Shopian
|
25.00
|
20.00
|
15.00
|
25.00
|
15.00
|
|
Srinagar
|
30.00
|
15.00
|
15.00
|
25.00
|
15.00
|
|
Udhampur
|
20.00
|
20.00
|
25.00
|
20.00
|
15.00
|
|
Mean
|
21.25
|
17.50
|
21.50
|
22.25
|
17.50
|
|
S.E. ±
|
1.43
|
1.12
|
1.08
|
1.65
|
1.16
|
|
C.D. 5%
|
2.86
|
2.24
|
2.17
|
3.30
|
2.33
|
|
Stand Dev.
|
6.04
|
3.03
|
4.00
|
3.43
|
2.56
|
|
Variance
|
36.51
|
9.21
|
16.05
|
11.77
|
6.57
|
|
Co-efficient of Variance
|
28.43
|
17.34
|
18.63
|
15.42
|
14.65
|
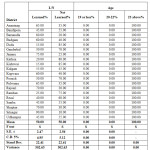 |
Table 2: Percentage of learned, not learned and different age group recorded in different districts of Jammu & Kashmir.
Click here to View table
|
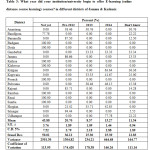 |
Table 3: What year did your institution/university begin to offer E-learning (online distance course learning) courses? in different districts of Jammu & Kashmir.
Click here to View table
|
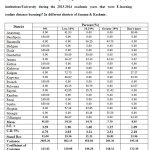 |
Table 4: What is the estimate percentage of total courses offered by your institutions/University during the 2013-2014 academic years that were E-learning (online distance learning)? In different districts of Jammu & Kashmir.
Click here to View table
|
Material Methods
This study’s objective was to have clear picture about the use and knowledge of e-learning by academics and teachers at the institutions so as to give new idea about development of e-learning (online courses) usage in institutions. Several relation was taken of demographic issues to see whether there were any statistically significant differences, extraneous to the college students and academics for e-learning provision that could influence respondent’s perception of the efficiency of their learning. The selected variables were the respondent’s specialization, previous learning by e-learning, year of beginning of e-learning in colleges and other. Questionnaires were distributed to 60 students and 40 academic members of different colleges of twenty districts of Jammu & Kashmir in order to identify the knowledge and usage of e-learning based on academic and students perceptions. The questionnaires include 9elements to ensure successfulness of E-learning, were analyzed for Analysis of variance (ANOVA) in a randomized block design with three replicates using and SPSSto understand the significance of differences between the elements[18].
Results
Result revealed in two parts in first is data collected from faculty and administrators and in second part data is collected from students to get a clear idea about the knowledge and improvement of e-learning
Part first Result
Perusal of the data appended in the Table 1 revealed that maximum mean percent was recorded from Arts (22.25) followed by computer science (21.50) and commerce (21.25). Minimum was recorded for other (17.50). Highest percentage (30.00) for distribution for specialization in computer science was recorded for district Jammu, Rajouri and Srinagar followed by Baramulla (25) and Budgam (25) whereas, rest of the districts showed significant difference with each other. However, minimum (10.00) was observed for district Doda and Kishtwar. Maximum percentage (20.00) for commerce specialization was observed for district Bandipora, Doda, Ganderbal, Jammu, Kathua, Kishtwar, Kupwara, Poonch, Ramban, Shopian and Udhampur however, rest of the districts showed significant difference with each other. Minimum (10.00) was observed for Rajouri. For Arts specialization height percentage (30.00) was observed for Doda followed by Anantnag (25.00) and Ganderbal (25.00) however, rest of the districts showed significant difference with each other. Lowest (15.00) was recorded for Jammu, Shopian and Srinagar districts. Highest percentage (30.00) for Science was recorded for Kishtwar district followed by Bandipora (25.00) and Budgam (25.00) respectively however, rest of the districts showed significant difference with each other. Minimum (15.00) was recorded for Pulwama districts. Highest percentage (20.00) for distribution for specialization in other Sciences was recorded for Doda, Ganderbal, Kathua, Kishtwar, Kulgam, Pulwama, Ramban and Reasi districts. Minimum (15.00) was observed for Bandipora, Ganderbal, Jammu, Kupwara, Poonch, Shopian and Udhampur districts.
It is evident from the data appended in Table 2 that highest mean percent (50.00) was observed for Learned whereas, as minimum mean percentage (50.00) was recorded for Not learned. It is also evident from the data appended that highest mean percent (100.00) for age was observed for 23 or above whereas, as minimum mean percentage (0.00) was recorded for 19 or less and 20-22. Maximum mean percentage (90.00) for Learned was found in district Srinagar followed by Baramulla (80.00) and Jammu (75.00) however, rest of the districts showed significant difference with each other. Minimum (15.00) was observed for district Doda and Kishtwar. Highest mean percent (85.00) for Not-learned was recorded for district Doda and Kishtwar which was statically at par with Kathua (80.00) however, rest of the districts showed significant difference with each other. Minimum (10.00) was observed for Srinagar district. Minimum mean percentage (0.00) was observed for both 19 or less and 20-22 age group. Maximum mean percent (100.00) for 23 or above was recorded for all the districts.
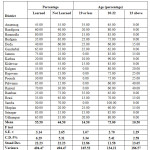 |
Table 6: Percentage of learned not learned and different age group recorded in different districts of Jammu & Kashmir.
Click here to View table
|
It is evident from the data appended in Table 3 that highest mean percent (43.88) was observed for those who do not have online (distance) courses yet is followed by (20.70) for those institutions who have started online (distance) courses before 2012 and (15.27) those who have started in year 2014 whereas, as minimum mean percentage (8.57) was recorded for those institutions who have started in the year 2013. Maximum mean percentage (100.00) for those who do not have online (distance) courses yet was found in district Budgam, Doda, Kathua, Kishtwar, Poonch, Ramban, Reasi and Samba followed by Bandipora (77.78). Minimum (0.00) was observed for rest of all districts. Highest mean percent (94.44) for those institutions who have started online (distance) courses before 2012 was recorded for district Srinagar followed by Baramulla (87.50), Jammu (86.66), Rajouri(85.71) Anantnag (38.46) and Shopian (21.42). Minimum (0.00) was observed for rest of all districts. Maximum mean percentage (38.46) for those institutions that have started online (distance) courses in the year 2013 was found in district Pulwama, followed by Shopian (35.71), Ganderbal (33.33), Kupwara (33.33) and Anantnag (30.76). Minimum (0.00) was observed for rest of all districts. Highest mean percent (77.78) for those institutions that have started online (distance) courses in the year 2014 was recorded for district Udhampur followed by Kulgam (63.64), Pulwama (43.15), Shopian (42.85) Kupwara (41.67) and Ganderbal (33.33). Minimum (0.00) was observed for rest of all districts. Greatest mean percent (36.36) for that faculty who don’t know when online (distance) courses is started in their institution was recorded for district Kulgam followed by Ganderbal (33.34) and Anantnag (30.76) whereas rest of districts showed significant difference with each other. Lowest (0.00) was observed for Budgam, Doda, Kathua, Kishtwar, Poonch, Ramban, Reasi, Samba and Shopian.
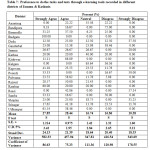 |
Table 7: Preference to do the tasks and tests through e-learning tools recorded in different districts of Jammu & Kashmir.
Click here to View table
|
It is evident from the data appended in Table 4 that highest mean percent (49.00) was observed by those institutions where 0% of E-learning (online distance) courses were offered during the year 2013-14 followed by those institutions where less than 10% of E-learning (online distance) courses were offered during the year 2013-14 (24.50) and those institutions where 10-19% E-learning (online distance) courses were offered during the year 2013-14 (14.59) whereas, as minimum mean percentage (7.70) was recorded for those institutions where Greater than 19% of E-learning (online distance) courses were offered during the year 2013-14. Maximum mean percentage (100) for those institutions where 0% of E-learning (online distance) courses offered during the year 2013-14 was found in district Bandipora, Budgam, Doda, Kathua, Kishtwar, Poonch, Ramban, Reasi and Samba. Minimum (0.00) was observed for rest of all districts. Highest mean percent (72.13) for those institutions where less than 10% of E-learning (online distance) courses offered during the year 2013-14 was recorded for district Kulgam followed by Kupwara (66.67) and Udhampur (66.67) however, rest of the districts showed significant difference with each other. Minimum (0.00) was observed for Bandipora, Baramulla, Budgam, Doda, Kathua, Kishtwar, Poonch, Ramban, Reasi, Samba and Srinagar. Maximum mean percentage (56.25) for those institutions where 10-19% of E-learning (online distance) courses offered during the year 2013-14 was found in district Baramulla, followed by Ganderbal (50.00) and Srinagar (45.44) however, rest of the districts showed significant difference with each other. Minimum (0.00) was observed for Anantnag, Bandipora, Budgam, Doda, Kathua, Kishtwar, Kulgam, Kupwara, Poonch, Ramban, Reasi, Samba and Udhampur. Highest mean percent (55.56) for those institutions where Greater than 19% of E-learning (online distance) courses offered during the year 2013-14 was recorded for district Srinagar followed by Baramulla (43.75), Jammu (33.33) and Rajouri (21.42). Minimum (0.00) was observed for rest of all. Greatest mean percent (38.46) for those faculty of institutions who don’t know the percentage of E-learning (online distance) courses offered during the year 2013-14 was recorded for district Anantnag followed by Kupwara (33.33) and Udhampur (33.33) however, rest of the districts showed significant difference with each other. Lowest (0.00) was observed for Bandipora, Baramulla, Budgam, Doda, Ganderbal, Kathua, Kishtwar Poonch, Ramban, Reasi, Samba and Srinagar.
Part Second Results
Perusal of the data appended in the Table 5 revealed that maximum mean percent was recorded from Arts (25.00) followed by Science (23.50) and computer science (20.75). Minimum was recorded for other (11.50). Highest percentage (30.00) for distribution for specialization in computer science was recorded for district Bandipora, Ganderbal and Jammu which was statistically at par with Doda (25.00), Kupwara (25.00), Pulwama (25.00), Rajouri (25.00), Srinagar (25.00) and Udhampur (25.00) whereas, rest of the districts showed significant difference with each other. However, minimum (0.00) was observed for district Reasi. Maximum percentage (25.00) for commerce specialization was observed for district Kishtwar, Kulgam, Kupwara, Poonch, Reasi, Shopian and Udhampur however, rest of the districts showed significant difference with each other. Minimum (0.00) was observed for Bandipora and Pulwama. For Arts specialization height percentage (45.00) was observed for Bandipora followed by Poonch (40.00) and Reasi (35.00) however, rest of the districts showed significant difference with each other. Lowest (15.00) was recorded for Anantnag, Budgam and Rajouri districts. Highest percentage (35.00) for Science was recorded for Shopian district which was statistically at par with Baramulla (30.00) and Ganderbal (30.00) however, rest of the districts showed significant difference with each other. Minimum (15.00) was recorded for Kishtwar and Rajouri districts. Highest percentage (30.00) for distribution for specialization in other Sciences was recorded for Pulwama and Rajouri districts however, rest of the districts showed significant difference with each other. Minimum (0.00) was observed for Bandipora, Ganderbal, Jammu, Kupwara, Poonch, Shopian and Udhampur districts.
It is evident from the data appended in Table 6 that highest mean percent (55.50) was observed for Learned whereas, as minimum mean percentage (44.50) was recorded for Not learned. It is also evident from the data appended that highest mean percent (75.00) for age was observed for 20-22 followed by 19 or less (14.50) whereas, as minimum mean percentage (10.50) was recorded for 23 or above. Maximum mean percentage (85.00) for Learned was found in district Kupwara, Pulwama and Srinagar which was statically at par with Baramulla (80.00) and Shopian (80.00) however, rest of the districts showed significant difference with each other. Minimum (20.00) was observed for district Kathua. Highest mean percent (80.00) for Not-learned was recorded for district Kathua which was statically at par with Ramban (75.00) however, rest of the districts showed significant difference with each other. Minimum (15.00) was observed for Kupwara, Pulwama and Srinagar. Maximum mean percentage (35.00) for 19 or less was found in district Anantnag, Ganderbal and Ramban, followed by Budgam (25.00), Doda (25.00) and Shopian (25.00) however, rest of the districts showed significant difference with each other. Minimum (0.00) was observed for Jammu, Kulgam, Kupwara, Poonch, Pulwama, Rajouri and Samba. Highest mean percent (100.00) for 20-22 was recorded for district Samba followed by Kathua (90.00) and Baramulla (85.00). Minimum (60.00) was observed for Doda, Pulwama, Rajouri and Shopian. Maximum mean percent (40.00) for 23 or above was recorded for district Pulwama and Rajouri followed by Kupwara (25.00) and Poonch (25.00) showed significant difference with each other. Lowest (0.00) was observed for Anantnag, Bandipora, Baramulla, Budgam, Ganderbal, Kathua, Kishtwar, Ramban, Samba, Srinagar and Udhampur.
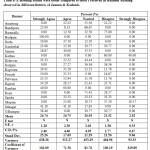 |
Table 8: E-learning results were better compared to those I received in tradition learning observed in different districts of Jammu & Kashmir.
Click here to View table
|
It is evident from the data appended in Table 7 that highest mean percent (28.44) was observed in Agree followed by Strongly Agree (27.85) and Disagree (16.86) whereas, as minimum mean percentage (10.38) was recorded for Strongly Disagree. Maximum mean percentage (100.00) for strongly Agree was found in district Budgam, followed by Udhampur (61.54) and Ramban (60.00) however, rest of districts showed significant difference with each other. Minimum (0.00) was observed for Anantnag, Kulgam and Reasi. Greatest mean percentage (88.89) for Agree was found in district Kishtwar followed by Pulwama (58.82) and Rajouri (50.00) however, rest of districts showed significant difference with each other. Lowest (0.00) was observed for Budgam, Kulgam and Poonch. Highest mean percent (63.64) for Neutral was recorded for district Kulgam followed by Anantnag (55.56) and Kathua (40.00) however, rest of the districts showed significant difference with each other. Minimum (0.00) was observed for Bandipora, Budgam, Kishtwar, Poonch, Reasi, Samba and Udhampur. Maximum mean percentage (75.00) for Disagree was found in district Bandipora followed by Samba (50.00) and Ganderbal (38.46) however, rest of districts showed significant difference with each other. Minimum (0.00) was observed for Budgam, Jammu, Kishtwar, Rajouri, Ramban, Reasi, Shopian and Udhampur. Greatest mean percentage (57.14) for Strongly Disagree was found in district Reasi, followed by Poonch (50), Doda (37.50), Shopian (31.25), Jammu (20) and Srinagar (11.76). Lowest (0.00) was observed for rest of all districts.
It is evident from the data appended in Table 8 that highest mean percent (26.03) was observed in Neutral followed by Agree (24.75) and strongly Agree (24.74) whereas, as minimum mean percentage (2.92) was recorded for strongly Disagree. Maximum mean percentage (100.00) for strongly Agree was found in district Budgam, followed by Doda (50.00) and Poonch (50.00) however, rest of districts showed significant difference with each other. Minimum (0.00) was observed for Anantnag, Baramulla, Kathua, Kulgam, Reasi, Samba and Shopian. Greatest mean percentage (60.00) for Agree was found in district Ramban, followed by Pulwama (52.94) and Srinagar (41.18) however, rest of districts showed significant difference with each other. Lowest (0.00) was observed for Budgam, Kathua, Reasi and Udhampur. Highest mean percent (71.43) for Neutral was recorded for district Reasi followed by Bandipora (66.67) and Anantnag (55.56) however, rest of the districts showed significant difference with each other. Minimum (0.00) was observed for Budgam, Kathua, Poonch and Ramban. Maximum mean percentage (75.00) for Disagree was found in district Baramulla followed by Kathua (60.00) and Shopian (37.50) however, rest of districts showed significant difference with each other. Minimum (0.00) was observed for Bandipora, Budgam, Doda, Jammu, Kishtwar, Ramban and Srinagar. Greatest mean percentage (40.00) for Strongly Disagree was found in district Kathua, followed by Shopian (18.57). Lowest (0.00) was observed for rest of all districts.
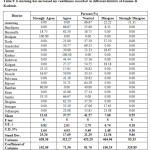 |
Table 9: E-learning has increased my confidence recorded in different districts of Jammu & Kashmir.
Click here to View table
|
It is evident from the data appended in Table 9 that highest mean percent (41.57) was observed in Neutral followed by Agree (37.57) and Strongly Agree (12.61) whereas, as minimum mean percentage (0.55) was recorded for Strongly Disagree. Maximum mean percentage (100.00) for strongly Agree was found in district Budgam, followed by Ramban (60.00) and Samba (33.33) however rest of districts showed significant difference with each other. Minimum (0.00) was observed for Anantnag, Bandipora, Doda, Ganderbal, Jammu, Kathua, Kishtwar, Kulgam, Pulwama, Rajouri, Reasi, Shopian, Srinagar and Udhampur. Greatest mean percentage (100.00) for Agree was found in district Kathua followed by Bandipora (66.67) and Samba (66.67) however, rest of districts showed significant difference with each other. Lowest (0.00) was observed for Anantnag, Budgam and Ramban. Highest mean percent (69.23) for Neutral was recorded for district Ganderbal which was statistically at par Anantnag (66.67) and Rajouri (64.29) however, rest of the districts showed significant difference with each other. Minimum (0.00) was observed for Budgam, Kathua, and Samba. Maximum mean percentage (37.50) for Disagree was found in district Doda followed by Jammu (26.67) and Udhampur (23.08). Minimum (0.00) was observed for Baramulla, Budgam, Ganderbal, Kathua, Kishtwar, Kupwara, Poonch, Pulwama, Rajouri, Ramban, Reasi, Samba and Shopian. Greatest mean percentage (11.11) for Strongly Disagree was found in district Anantnag, Lowest (0.00) was observed for rest of all districts.
Conclusion
From this research we conclude that those who are aware of the e-learning are supporting the e-learning and the students are having benefits from e-learning but as we saw that only few districts have e-learning system of education and from this point of view it is clear that the administration is not so much interested in encouraging the e-learning system. Students who know about the e-learning are supporting and faculty members also but every district don’t have this type of education system, even some of the faculty members and students are unaware about e-learning, so to develop the e-learning system in Jammu and Kashmir administration must start online courses and teach basic use of e-learning as well as they must implement the e-learning education system in every institute of Jammu and Kashmir so that students can get better material for learning and faculty will also give their better performance by teaching more of their concerned subject. Major benefit of the e-Learning is that we can make learning always ON. E-Learning is not restricted to any place and environment.
Refrences
- Bottino, R.M., The evolution of ICT‐based learning environments: which perspectives for the school of the future? British Journal of Educational Technology, 2004. 35(5): p. 553-567.
CrossRef
- Ali, G.E. and R. Magalhaes, Barriers to implementing e‐learning: a J&ki case study. International journal of training and development, 2008. 12(1): p. 36-53.
CrossRef
- Al-Kazemi, A.A. and A.J. Ali, Managerial problems in J&k. Journal of Management Development, 2002. 21(5): p. 366-375.
CrossRef
- Holmes, B., Gardner, J., 2006. e-Learning: Concepts and Practice. Sage, London.
- Garrison, D., Anderson, T., 2003. e-Learning in the 21st Century: A Framework for Research and Practice. Routledge, New York.
- Khan, B., 2005. Managing e-Learning: Design, Delivery, Implementation and Evaluation. Information Science Publishing, Hershey.
CrossRef
- Pittinsky, M. & Chase, B. (2000). Quality on the Line: Benchmarks for Success in Internet-based Distance Education, The Institute for Higher Education Policy. Washington, D.C.: National Education Association.
- Byrne, R. (2002). Web-based Learning versus Traditional Management Development Methods. Singapore Management Review, 24, 59-68.
- Jung, I., Choi, S., Lim, C., & Leem, J. (2002). Effects of Different Types of Interaction on Learning Achievement, Satisfaction and Participation in Web-Based Instruction. Innovations in Education and Teaching International, 39, 153-162.
CrossRef
- McClelland, B. (2001). Digital Learning and Teaching: Evaluation of Developments for Students in Higher Education. European Journal of Engineering Education, 26, 107-115.
CrossRef
- Motiwallo, L., & Tello, S. (2000). Distance Learning On the Internet: An Exploratory Study. The Internet and Higher Education, 2, 253-264.
CrossRef
- Teh, G.P.L. (1999). Assessing Student Perceptions of Internet-based Online Learning Environment. International Journal of Instructional Media, 26, 397-402.
- Savenye, W.C., Olina, Z, & Niemczyk, M. (2001). So You are Going to be an Online Writing Instructor: Issues in Designing, Developing, and Delivering an Online Course. Computers and Composition, 18, 371-385.
CrossRef
- Owston, R.D., & Wideman, H.H. (1998). Teacher Factors that Contribute to the Implementation Success in TeleLearning Network. Center for the Study of Computers in Education Technical Report no. 98-3, Toronto, ON: Faculty of Education, York University. Retrieved April 12, 2006 from http://www.yorku.ca/irlt/reports/techreport98-3.htm.
- Smith, L.J. (2001). Content and Delivery: a Comparison and Contrast of Electronic and Traditional MBA Marketing Planning Courses. Journal of Marketing Education, 23, 35-44.
CrossRef
- Lawhead, P.B., Alpert, E., Bland, C.G., Carswell, L., Cizmar, D., DeWitt, J., Dumitru, M., Fahraeus, E.R., & Scott, K. (1997). The Web and Distance Learning: What is Appropriate and What is not. ITiCSE’97 Working Group Reports and Supplemental Proceedings, ACM SIGCSE/SIGCUE, pp.27-37.
CrossRef
- Pittinsky, M. & Chase, B. (2000). Quality on the Line: Benchmarks for Success in Internet-based Distance Education, The Institute for Higher Education Policy. Washington, D.C.: National Education Association.
- K. A. Gomez, and A. A. Gomez, Statistical procedures for Agricultural Research, New York: John Willy and Sons, 1984.

This work is licensed under a Creative Commons Attribution 4.0 International License.
 and Jagbir Ahlawat*