Cellular Automata Based Study of Spectral Signatures of Dal_Lake Infrared Imagery
Fasel Qadir
Associate Professor Department of Computer Sciences,North Campus (Delina, Baramulla),University of Kashmir
DOI : http://dx.doi.org/10.13005/ojcst/10.02.04
Article Publishing History
Article Received on :
Article Accepted on :
Article Published : 18 May 2017
Article Metrics
ABSTRACT:
Among all the water bodies in Jammu & Kashmir Dal Lake has a peculiar significance due to its location in the heart of the capital city Srinagar. Historical studies over last fifteen hundred years indicate a continuous squeezing of the Lake due to different natural and manmade interventions. Over this long period, the governance of the land has passed through various wise and ugly human plans besides some slow natural processes. The mathematical modelling of such a dynamics is not an easy task because of the many intervening variables and the difficulty which implies their measurements. On the other hand, during the last decades, the use of Cellular Automata (CA) techniques to simulate the behaviour of linear or non-linear systems is becoming of great interest. This fact is mainly due to the fact that this approach depends largely on local relations and a series of rules instead of precise mathematical formulae. The infrared (IR) satellite imagery can be helpful in identifying the different areas of interest using CA as a tool of image processing. The study will not only separate the areas of interest but also pave a way towards a comprehensive study of all the identified zones using spectral signatures received from the continuous IR imagery of both pre-monsoon and post-monsoon periods in future.
KEYWORDS:
cellular automata; image processing; remote sensing; edge detection
Copy the following to cite this article:
Qadir F. A Novel Approach to Address Sensor Interoperability Using Gabor Filter. Orient.J. Comp. Sci. and Technol;10(2)
|
Copy the following to cite this URL:
Qadir F. A Novel Approach to Address Sensor Interoperability Using Gabor Filter. Orient. J. Comp. Sci. and Technol;10(2). Available from: http://www.computerscijournal.org/?p=5755
|
Introduction
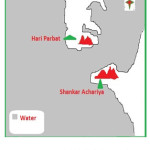
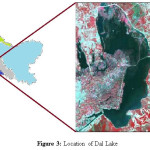
The valley of Kashmir in the early history records has been discovered as a wide basin between the mountains as illustrated in the Figure 1. With time the shallower regions have converted to land mass. From the maximum waters, now the land has turned into this state of maximum land mass. The location of the Dal Lake in the capital city of Srinagar is to the North-East of the main city but the overall status of Srinagar can be said to be on the peripheries of the lake as illustrated in the Figure 3. This aspect on one hand gives a unique charm to the city but the same feature creates a hazardous impact of the health of this glorious water body. Human population residing inside (Houseboats) and on the banks of the lake are big contributor of pollution to the lake. The lake at present has the north peak at (34º-15, 74º-85) Tailbal, the east end at (34º-12, 74º-88) near Nishat, the south face at (34º-08, 74º-83) Dalgate, and the west node at (34º-11, 74º-82) near Hari Parbat. Kango and Fotedar in 1982 reported that the lake has shrunk from 23.4 sq. Km. to 13.82 sq. Km. Zutshi and Kundangar, on the basis of maps and surveys by Montogmeri compared with the ground situation in1983, reported the area to be as 10.56 sq. Km [4]. The current revenue department records estimate the total area of the lake as 50432 kanals of which about 20% is land mass and the rest open waters.
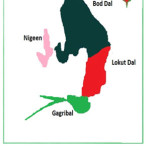
Water body has seen a lot of interventions both manmade and natural through its history. Budshah (Zain-ul-Abideen) the famous king of Kashmir from 1420-1470 AD projected firstly the Dal lake as a recreational place and beautified its surroundings. As such the tourist attractive history of the lake is about six centuries old. The vegetable and Nadroo cultivation was restricted to specified areas. Sonalank (Island) presently identified by three Chinars in the Bod Dal infront of Hazaratbal was constructed by Zain-ul-Abideen (Budshah). During Mughal Period Sultan Hassan Shah (1475-1478 AD) built another island (Rupalank) currently identified by four Chinars. Sultan Sikander in 1413 AD constructed a strong bund path from Nayidyar, Rainawari to Nishat through the mid waters of the lake. The lake thus with all these interventions is presently divided into four parts as illustrated in the Figure 2, viz Bod Dal (In front of Hazaratbal), Lokut Dal (Between Nishat and Gagribal), Gagribal (Southern part) and the Nigeen (Eastern side of Hari Parbat).
Various studies carried out, mostly in the recent past indicate that the level of pollutants both organic and inorganic in the Dal have accelerated the macrophytic growth resulting in diminished water quality and Biological Oxygen Demand of the lake. Kundangar and Abubakar have reported the detailed work of pollution and restoration of the water body under the Lakes and Waterways Development Authority of J&K Government [1]. Murtaza et al. reported the increase of air temperature, alkalinity, specific conductivity, nitrate nitrogen and phosphorus and decline in water temperature, pH, dissolved oxygen, silicates and ammonical nitrogen [2]. Fazal and Amin reported the effects of waste water logging and climate changes due to shrinking of the water body [3]. Tali and Murthy reported the hazardous effects of population increase around the Lake habitation on the environment due to enormous increase in sewage and drainage [4].
There are limited reports of research works carried out with the help of satellite images to explore the ways of conservation for this important water body. Among the reported works [3, 4] have used satellite images, is an encouraging development. NATIONAL WETLAND ATLAS, JAMMU AND KASHMIR under National Wetland Inventory and Assessment (NWIA), 2010 has reported different physical features of various water bodies of the state including the Dal Lake. There are not previous works related to the study of spectral signatures of satellite images with CA. The aim of our proposed work is to pave a way to develop a database for the better conservation of this beautiful lake.
Cellular Automata
A cellular automaton is used in Computer Science as a discrete model for implementing algorithms. Studying its abstract properties yields many insights into what we called a digital image. Despite its simplicity it simulates complex phenomena’s whereas different research studies based on this tool is the witness of the popularity of CA. It consists of a regular grid of cells, each in one of a finite number of states. The grid can be in any finite number of dimensions. For each cell, a set of cells called its neighborhood(usually including the cell itself) is defined relative to the specified cell. For example, the neighborhood of a cell might be defined as the set of cells a distance of 3 or less from the cell. An initial state (time t=0) is selected by assigning a state for each cell. A new generationis created (advancing t by 1), according to some fixed rule (generally, a mathematical function) that determines the new state of each cell in terms of the current state of the cell and the states of the cells in its neighborhood. Typically, the rule for updating the state of cells is the same for each cell and does not change over time, and is applied to the whole grid simultaneously, though exceptions are known.
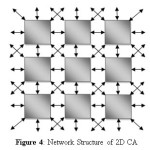
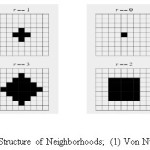
As the image has a two dimensional (2D) topology, therefore we use 2D model of CA. In a 2D CA model, the cells are arranged in a 2D grid with connections among the neighboring cells, as shown in the Figure 4. The central box represents the current cell (that is, the cell being considered) and all other boxes represent the eight nearest neighbors of that cell.
In our experiment, a rectangular regular grid is used to represent a digital image and each cell represents one pixel of the image. So initial configuration at t=0, is the original image. Before designing image scrambling method based on CA, it is necessary to determine the structure of the neighbors firstly. The structure of the neighbors mainly includes Von Neumann neighborhood and Moore neighborhood, discussed below;
Von Neumann Neighborhood
The Von Neumann neighborhood of a 2D CA is a diamond shaped neighborhood surrounding the cell (x0, y0) and can be defined as follows [5]:
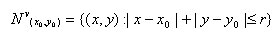
Note that the neighborhood defines a radius. This variable can be introduced to enlarge the neighborhood by setting the radii with different integer values. The neighborhood can be visually illustrated in the Figure 4(1), for radii that vary from zero to three.
Moore Neighborhood
The Moore neighborhood of a 2D CA is a square shaped neighborhood surrounding the cell (x0, y0) and can be defined as follows [6]:
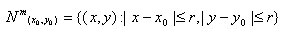
The Moore neighborhood also defines a radius but differs from the Von Neumann neighborhood in that, the Moore neighborhood also includes neighbor cell on the diagonals. A visual illustration of the Moore neighborhood can be seen in the Figure 4(2), for radii that vary from zero to three.
Proposed Methodology
The application of CA in determining the spectral signatures of satellite images is a new field of investigation. To identify different physical features of the lake from the satellite imagery, we have proposed the contour determination of these features using CA. The proposed method classifies the pixels based on spectral signatures and thus improves the results obtained by classical methods. The contours of interest are further investigated for their spatial signatures using the emissivity characteristics from the work carried out by various scholars like Wilber et al. [8] or as given in the Table 1.
When we work with satellite images, we consider each pixel of the image as a cell of the CA and we normally take the 8 around pixels as neighbourhood (Moore Neighborhood), although we can take the 4 around pixels (Von Neumann Neighborhood) or even the 24 around pixels (Extended Moore Neighborhood). The changes in cells states occur in discrete time form. In each iteration, rules are applied through the transition function f to each cell taking into account the around neighbourhood to change its state. The CA algorithm for this task is given as follow:
At first, we use the IR satellite image denoted by f(x,y) for initial conditions. Then, calculate statistical data M and from data it is easy to find a bigger threshold value v. At the same time, we establish a matrix B[bi.j]m*n , where i=1,2,3,——-,m and j=1,2,3,——n
If mi,j>=v
Then bi,j =1
Else
bi,j=0
Lattice geometry: 2D of size m×n.
Neighbourhood: Moore’s neighbourhood with radius r=1.
Boundary condition: periodic on all four sides.
Initial condition: the matrix B.
State set: s={0,1}.
Transition function: Rule 510P.
The contour determination methods are one of the most important techniques used in remote sensing that help developers to interpret the information contained in the satellite images. The aim of satellite images contour determination is to divide image pixels into different regions. The resulting image is essentially a thematic map of the original image and hence carries ideal topological feature of the river, which can be used for further pattern matching and pattern recognition.
Experimental Results and Discussions
For this experimentation, we have used IR satellite image as shown in the Figure 3 from NWIA, 2010. Figure 5 shows the comparative results of the Prewitt, Robert and our proposed methods, whereas Figure 5(a) is the image produced by Prewitt operator, Figure 5(b) is the image produced by Robert operator, Figure 5(c) is the image produced by rule 511p, & Figure 5(d) is the image produced by Fuzzy Rules (FR1). It is clearly visible from the results that the proposed methods of contour determination are the best methods than Prewitt & Soble methods. Thanks to these results, experts can detect visually much more valuable information in the process of satellite images analysis.
Table 1: Surface emissivity maps for use in satellite retrievals of long wave radiation
|
S. No.
|
Material/Object
|
Emissivity (e)
|
|
1
2
3
4
5
6
7
8
9
10
11
12
13
14
15
16
17
18
19
|
Clear water
Wet snow
Human skin
Rough Ice
Healthy Green Vegetation
Wet Soil
Asphaltic Concrete
Brick
Basaltic Rock
Dry Mineral Soil
Portland Cement Concrete
Paint
Dry Vegetation
Dry Snow
Granite Rock
Glass
Sheet Iron (rusted)
Polished Metals
Aluminum foil
|
0.98-0.99
0.98-0.99
0.97-0.99
0.97-0.98
0.96-0.99
0.95-0.98
0.94-0.97
0.93-0.94
0.92-0.96
0.92-0.94
0.92-0.94
0.90-0.96
0.88-0.94
0.85-0.90
0.83-0.87
0.77-0.81
0.63-0.71
0.16-0.21
0.03-0.07
|
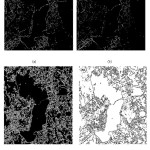 |
Figure 5: Comparison results of contour detection for IR satellite imagery: (a) image obtained by Prewitt; (b) Image obtained by Robert; (c) Image obtained by Rule 511P; and, (d) Image obtained by FR1.
Click here to View figure
|
Conclusions and Future Work
The contour determination work on the selected IR image of Dal Lake and its adjoining areas will be useful information to develop a GIS database for identifying its various attributes for not only the comprehensive studies in future but also a demarcation seal to discourage any future encroachments. The encroachments to this water body are currently posing an enormous threat and it will be to the advantage of the controlling bodies to keep better watch on physical assets of this lake. The spatial signatures of the demarked contours that identify the different areas of interest will also be used to keep watch on their degradability status. The predictions can also be made about the degradability rate of various regions inside the water body on the pattern of the work explored by Novaline Jacob et al. [7]. The future works can be carried out broadly taking the contour parameters separately and studying them more closely in depth for better solution of the problems faced by this water body. Further works can be carried out to look whether spatial signatures are helpful in the estimation of chemical behavior of the regions of interest.
References
- Kundangar, M. R. D. & Abubakar, A. Three decades of dal lake pollution-restoration. Journal of Ecology and Environmental Conservation,15(4):825-833, 2009.
- Murtaza, S., Malik, A. A., Ali, S. M. F., & Hussain, S. A. Impact of pollutants on physicochemical characteristics of Dal lake under temperate conditions of Kashmir. Published: August 06, 2010.( www.forestrynepal.org)
- Fazal, S. & Amin, A. Impact of urban land transformation on water bodies in Srinagar city, India. Journal of Environmental Protection, 2:142-153, 2011.
CrossRef
- Tali, J. A. & Murthy, K. Impact of demographic and areal changes on urban growth: a case study of Srinagar city. International Journal of Environmental Sciences, 4(10):74-79, 2012.
- E. W. Weisstein. Mathworld–a wolfram web resource: von neumann neighborhood. http://mathworld.wolfram.com/vonNeumannNeighborhood.html.
- E. W. Weisstein. Mathworld–a wolfram web resource: Moore neighborhood. http://mathworld.wolfram.com/MooreNeighborhood.html.
- J. Novaline, R. Krishnan, R. Prasada, J. Saibaba. Spatial and Dynamic Modeling Techniques for and use Change Dynamics Study. The International Archives of the Photogrammetry, Remote Sensing and Spatial Information Sciences. XXXVII(B2):37-43, Beijing 2008.
- Wilber, A. C., Kratz, D. P., & Gupta, S. K. Suface emissivity maps for use in satellite retrievals of long wave radiation. NASA Langley Research Center, Hampton, Virginia Pages 23681-2199, 1999.

This work is licensed under a Creative Commons Attribution 4.0 International License.